3.4 IMAGE AND TRANSPORT ANALYSES
3.4 Image and Transport Analyses
− 画像及び破片の軌道分析 −
− 画像及び破片の軌道分析 −
At 81.9 seconds after launch of STS-107, a sizable piece of foam struck the leading edge of Columbias left wing.Visual evidence established the source of the foam as the left bipod ramp area of the External Tank. The widely accepted implausibility of foam causing significant damage to the wing leading edge system led the Board to conduct independent tests to characterize the impact. While it was impossible to determine the precise impact parameters because of uncertainties about the foams density, dimensions, shape, and initial velocity, intensive work by the Board, NASA, and contractors provided credible ranges for these elements. The Board used a combination of tests and analyses to conclude that the foam strike observed during the flight of STS-107 was the direct, physical cause of the accident.
STS-107の打ち上げから81.9秒後に、コロンビアの左翼前縁部にかなり大きな断熱材の破片が衝突しました。映像から、この断熱材が外部燃料タンクの左バイポッド傾斜部から脱落したことが明らかになりました。断熱材の衝突が主翼前縁部に深刻な損傷を与えるという考えは、当初あまり受け入れられていませんでしたが、衝突の特徴を明らかにするために調査委員会が独自に行ったテストによって、広く受け入れられるようになりました。しかし、断熱材の密度やサイズ、形、初速などの値は不確かなもので、正確なパラメーターを知ることは出来ませんが、調査委員会とNASA、契約企業による徹底的な調査により、かなり信頼性の高い、それぞれの値が取りうる範囲が分かっています。調査委員会は、テストと分析の結果から、STS-107のフライトで観測された断熱材の衝突が事故の直接の物理的原因であると断定しました。
Image Analysis: Size, Velocity, Origin, and Impact Area
画像分析 : 断熱材のサイズ、速度、脱落箇所、衝突の範囲
The investigation image analysis team included members from Johnson Space Center Image Analysis, Johnson Space Center Engineering, Kennedy Space Center PhotoAnalysis, Marshall Space Flight Center Photo Analysis, Lockheed Martin Management and Data Systems, the National Imagery and Mapping Agency, Boeing Systems Integration, and Langley Research Center. Each member of the image analysis team performed independent analyses using tools and methods of their own choosing. Representatives of the Board participated regularly in the meetings and delibera- tions of the image analysis team.
画像分析調査チームは、次のような組織からのメンバーを含んでいました。ジョンソン宇宙センター画像分析部門、ジョンソン宇宙センターエンジニアリング部門、ケネディ宇宙センター画像分析部門、マーシャル宇宙飛行センター画像分析部門、ロッキードマーティンマネジメントおよびデータシステム部門、NIMA (National Imagery and Mapping Agency)、ボーイングシステム調査部門、ラングレー研究センター。それぞれの組織の画像分析チームは、それぞれ別々に独自のツールと調査手法を使って画像の分析を行いました。調査委員会の代表は、それぞれの画像分析チームと定期的に打ち合わせを行い、彼らの討議に参加しました。
A 35-mm film camera, E212, which recorded the foam strike from 17 miles away, and video camera E208, which recorded it from 26 miles away, provided the best of the available evidence. Analysis of this visual evidence (see Figures 3.4-1 and 3.4-2) along with computer-aided design analysis, refined the potential impact area to less than 20 square feet in RCC panels 6 through 9 (see Figure 3.4-3), including a portion of the corresponding carrier panels and adjacent tiles. The investigation image analysis team found no conclusive visual evidence of post-impact debris flowing over the top of the wing.
17マイル離れた位置から断熱材の衝突を記録したE212の35mmフィルムカメラと、26マイル離れたE208ビデオカメラが、モッtも有力な証拠となりました。この画像による証拠(図:3-4-1、図:3-4-2) から、CAD(Computer-aided design) システムによる分析が行われ、衝突時の場所が、6番から9番RCCパネルとそれに対応するキャリアパネルと調整用のタイルを含む20平方フィートのエリア(図:3-4-3)に特定されました。画像分析調査チームは破片衝突後の破片が翼の上面を流れた確たる証拠は発見していません。
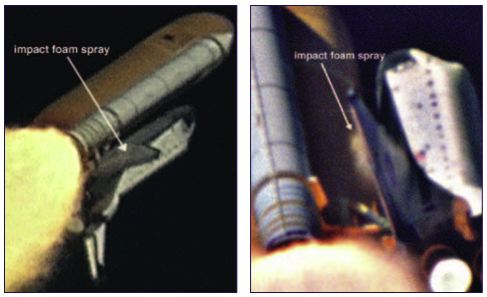
Figure 3.4-1 (color enhanced and "de-blurred" by Lockheed Mar- tin Gaithersburg) and Figure 3.4-2 (processed by the National Imagery and Mapping Agency) are samples of the type of visual data used to establish the time of the impact (81.9 seconds), the altitude at which it occurred (65,860 feet), and the objects rela- tive velocity at impact (about 545 mph relative to the Orbiter). Com puted trajector y
図3-4-1 : (ロッキードマーティン・ゲイザーズバーグによって色彩が強調され、画像のぶれが補正されたもの) 、図 : 3-4-2 (NIMAによって処理されたもの) これらの画像は、衝突が起きた時間(81.9秒)、高度(65,860フィート)、破片の相対速度(時速545マイル、破片の軌道などを明らかにするために使用された物のサンプルです。
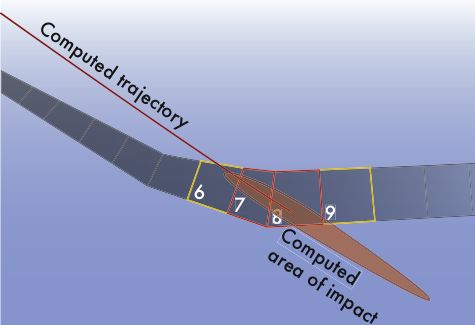
Figure 3.4-3: The best estimate of the site of impact by the center of the foam.
図3-4-3 : 最も可能性の高い、破片の中心部分が衝突したと思われるエリア
(訳注:画像が傾けられています。左上、赤いラインがのびている方向が機首)
(訳注:画像が傾けられています。左上、赤いラインがのびている方向が機首)
The image analysis team established impact velocities from 625 to 840 feet per second ( about 400 to 600 mph)relative to the Orbiter, and foam dimensions from 21 to 27 inches long by 12 to 18 inches wide.*8 The wide range for these measure- ments is due primarily to the cameras relatively slow frame rate and poor resolution. For example, a 20-inch change in the position of the foam near the impact point would change the estimated relative impact speed from 675 feet per second to 825 feet per second. The visual evidence could not reveal the foams shape, but the team was able to describe it as flat and relatively thin. The mass and hence the volume of the foam was determined from the velocity estimates and their ballistic coefficients.
画像分析チームは、衝突時の速度はオービターに対して毎秒625〜840フィート(毎時400〜600マイル)、破片のサイズは長さ21〜27インチ、幅12〜18インチほどであることを明らかにしました。これらの数値に広い範囲が取られているのは、比較的カメラのフレームレートと解像度が低かったためです。例えば、衝突位置付近で破片の位置には20インチの誤差がありますが、これは毎秒625〜840フィートという衝突時の相対速度の誤差によるものです。画像からは断熱材の形は分かりませんでしたが、どうやらこの破片は平たく比較的薄いようです。断熱材の重量と体積は、概算の速度と弾道係数(訳注 : 弾道係数は物体がどれくらい流線型に近いかという値。ここでは破片の速度から逆算されたものと思われます)から導き出されました。
Image analysis determined that the foam was moving almost parallel to the Orbiters fuselage at impact, with about a five-degree angle upward toward the bottom of the wing and slight motion in the outboard direction. If the foam had hit the tiles adjacent to the leading edge, the angle of incidence would have been about five degrees (the angle of incidence is the angle between the relative velocity of the projectile and the plane of the impacted surface). Because the wing leading edge curves, the angle of incidence increases as the point of impact approaches the apex of an RCC panel. Image and transport analyses estimated that for impact on RCC panel 8, the angle of incidence was between 10 and 20 degrees (see Figure 3.4-4).*9 Because the total force delivered by the impact depends on the angle of incidence, a foam strike near the apex of an RCC panel could have delivered about twice the force as an impact close to the base of the panel.
画像の分析によって、衝突時には破片がオービターの胴体とほぼ平行に、主翼の下面に対して5度上向きに落下しており、外側に向かってわずかに回転していることが分かりました。もし、断熱材が主翼前縁部付近のの耐熱タイルに衝突したとすれば、入射角は5度程度だったはずです(入射角とは、衝突した物体の移動方向と衝突された表面がなす角度のことです)。主翼前縁部がカーブしているため、入射角は衝突した場所がRCCパネルの頂点に近づくにつれて大きくなります。画像及び軌道の分析によって、衝突は8番RCCパネルに、入射角10〜20度で起きたと推定されました(図:3-4-4)。衝突時の衝撃は入射角で決まります。そのため、RCCパネルの頂点付近への衝突はパネル下面付近への衝突時の約2倍にもなります。
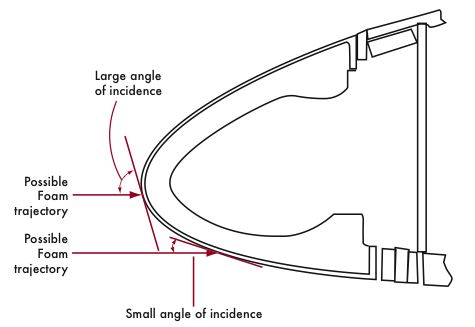
Figure 3.4-4. This drawing shows the curve of the wing leading edge and illustrates the difference the angle of incidence has on the effect of the foam strike.
図3-4-4 : この図面は主翼前縁部の曲線を示し、入射角の違いが断熱材の衝突にどのように影響するかを表しています。
Despite the uncertainties and potential errors in the data, the Board concurred with conclusions made unanimously by the post-flight image analysis team and concludes the informa- tion available about the foam impact during the mission was adequate to determine its effect on both the thermal tiles and RCC. Those conclusions made during the mission follow:
不明な点や潜在的なデータのエラーの可能性があったにもかかわらず、事故調査委員会は全員一致して飛行後画像解析チームに同意し、これによって得られたミッション中に起きた断熱材の衝突が、耐熱タイルとRCCパネルの両方に相当の影響を与えたと考えました。画像分析による結論は以下の通りです。
- The bipod ramp was the source of the foam.
- Multiple pieces of foam were generated, but there was no evidence of more than one strike to the Orbiter.
- The center of the foam struck the leading edge structural subsystem of the left wing between panels 6 to 9. The potential impact location included the corresponding carrier panels, T-seals, and adjacent tiles. (Based on fur- ther image analysis performed by the National Imagery and Mapping Agency, the transport analysis that fol- lows, and forensic evidence, the Board concluded that a smaller estimated impact area in the immediate vicinity of panel 8 was credible.)
- Estimates of the impact location and velocities rely on timing of camera images and foam position measure- ments.
- The relative velocity of the foam at impact was 625 to 840 feet per second. (The Board agreed on a narrower speed range based on a transport analysis that follows.)
- The trajectory of the foam at impact was essentially parallel to the Orbiters fuselage.
- The foam was making about 18 revolutions per second as it fell.
- The orientation at impact could not be determined.
- The foam that struck the wing was 24 (plus or minus 3) inches by 15 (plus or minus 3) inches. The foam shape could only be described as flat. (Asubsequent transport analysis estimated a thickness.)
- Ice was not present on the external surface of the bipod ramp during the last Ice Team camera scan prior to launch (at approximately Tュ5 minutes).
- There was no visual evidence of the presence of other materials inside the bipod ramp.
- The foam impact generated a cloud of pulverized debris with very little component of velocity away from the wing.
- In addition, the visual evidence showed two sizable, traceable post-strike debris pieces with a significant component of velocity away from the wing.
- 断熱材はバイポッド傾斜部から脱落した。
- 複数の破片が脱落したが、オービターへの1つ以上の断熱材の衝突は確認できていない。
- 断熱材の中心が衝突したのは、左翼前縁部構造6番から9番パネルの間である。このエリアではこの他に、対応するキャリアパネル、T-シール、および隣接するタイルへの衝突の可能性がある(さらに、NIMAによる画像分析、軌道分析、物的証拠に基づき、調査委員会は衝突は8番パネル付近で起きた可能性が高いという結論に達した)
- 衝突の場所とその時の速度は個々の画像の撮影されたタイミングと断熱材の位置の推定に依拠している
- 衝突時の断熱材の相対速度は毎秒625から840フィートの範囲。(調査委員会は、先で述べる軌道分析に基づいて、さらに細かい範囲にしぼっている)
- 衝突時の断熱材の軌道は、ほぼオービターの胴体と平行だった。
- 断熱材は、落下中、一秒間に約18回転している。
- 衝突時の断熱材の姿勢は不明。
- 主翼に衝突した断熱材は24(±3)インチ×15(±3インチ)。断熱材の形は平らな形をしているという以上は分からない(軌道分析によって厚さが推定されている)。
- 打ち上げ前に行われた着氷確認チームによるカメラスキャンでは、バイポッド傾斜部への着氷は確認されなかった(これは打ち上げの約5分前に行われている)。
- バイポッド鶏舎部内部に他の物体が混ざっていたという視覚的な証拠は無い。
- 断熱材の衝突によって、断熱材は粉々になり雲状の破片となって非常に小さな速度成分で飛び散った。
- 衝突後、さらに2つのかなり大きい破片が速い速度で主翼から離れていくのが確認されている。
Although the investigation image analysis team found no evidence of post-strike debris going over the top of the wing before or after impact, a colorimetric analysis by the National Imagery and Mapping Agency indicated the potential presence of debris material over the top of the left wing immediately following the foam strike. This analysis suggests that some of the foam may have struck closer to the apex of the wing than what occurred during the impact tests described below.
画像分析調査チームは、衝突の前後に破片が主翼の上面を越えていったという証拠は見つけることが出来ませんでしたが、NIMAによる色調を強調した画像による分析によると、断熱材の衝突の直後に破片が主翼の上面を越えている可能性があることが分かりました。これは、以下で言及している衝突テストで行われた位置よりも、さらに頂点に近い位置に断熱材が衝突している可能性を示唆します。
Imaging Issues
画像/映像撮影に関する問題点
The image analysis was hampered by the lack of high resolution and high speed ground-based cameras. The existing camera locations are a legacy of earlier NASA programs, and are not optimum for the high-inclination Space Shuttle missions to the International Space Station and oftentimes cameras are not operating or, as in the case of STS-107, out of focus. Launch Commit Criteria should include that sufficient cameras are operating to track the Shuttle from liftoff to Solid Rocket Booster separation.
画像分析は高画質で高速度撮影が可能な地上カメラが無かったために困難名ものとなりました。既存のカメラは初期のNASAのプログラムから引き継いだもので、国際宇宙ステーションへのスペースシャトルミッションのような傾斜角の大きい打ち上げには適しません。また、これらのカメラはしばしば動作しなかったり、STS-107でそうだったように、ピントが外れたりするのです。今後、打ち上げ基準(Launch Commit Criteria)には、充分な数のカメラによって、固体燃料ロケットブースターの切り離しまで、シャトルを追跡することが含まれる必要があります。
Similarly, a developmental vehicle like the Shuttle should be equipped with high resolution cameras that monitor potential hazard areas.The wing leading edge system, the area around the landing gear doors, and other critical Thermal Protection System elements need to be imaged to check for damage. Debris sources, such as the External Tank, also need to be monitored. Such critical images need to be downlinked so that potential problems are identified as soon as possible.
同様に、今後シャトルに似た宇宙機を開発するならば、危険性の高い場所をモニターするための高解像度のカメラを搭載するべきです。主翼前縁部、着陸脚収納部ドアの周辺、その他の重要性の高い部分の耐熱システムなどの撮影が行われる必要があるでしょう。また、外部燃料タンクなどの破片の脱落元となりうる部分もモニターされなければなりません。これらの画像は、潜在的な危険性を明らかにするために、できるだけ早く機体から地上局へ送信される必要があるでしょう。
Transport Analysis: Establishing Foam Path by Computational Fluid Dynamics
軌道分析 : 流体力学シミュレーションによる破片の軌道の特定
Transport analysis is the process of determining the path of the foam. To refine the Boards understanding of the foam strike, a transport analysis team, consisting of members from Johnson Space Center, Ames Research Center, and Boeing, augmented the image analysis teams research.
軌道分析とは断熱材の軌道を特定するプロセスを意味します。画像分析チームの調査を補強し、調査委員会の断熱材の衝突に関する理解をさらに深め、ジョンソン宇宙センター、エイムズ研究センター、ボーイングからのメンバーによる軌道分析チームが組織されました。
A variety of computer models were used to estimate the volume of the foam, as well as to refine the estimates of its velocity, its other dimensions, and the impact location. Figure 3.4-5 lists the velocity and foam size estimates produced during the mission and at the conclusion of the investigation.
断熱材の体積を推定するだけでなく、衝突の場所、形状、速度の推定値をより正確なものとするために、種々のコンピューターモデルが使われました。図:3-4-5にミッション中および調査の結論として提出された断熱材の速度と断熱材のサイズの見積りを示します。
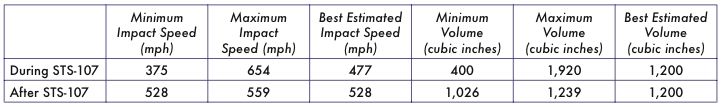
Figure 3.4-5. The best estimates of velocities and volumes calculated during the mission and after the accident based on visual evidence and computer analyses. Information available during the mission was adequate to determine the foams effect on both thermal tiles and RCC.
図3-4-5 : 画像分析とコンピューターによる分析から導きだされた、STS-107のミッション中および事故後の断熱材の速度とサイズのめやす。ミッション中の予測値は断熱材が耐熱タイルおよびRCCパネルの両方に影響を与えうる量として出されたものです。
The results listed in Figure 3.4-5 demonstrate that reasonably accurate estimates of the foam size and impact velocity were available during the mission. Despite the lack of high- quality visual evidence, the input data available to assess the impact damage during the mission was adequate.
図3-4-5に上げられた数値は、ミッション中に許容される断熱材の衝突速度とサイズとして厳密に定められたものです。これらは、高解像度の画像が得られないとしても、ミッション中の衝突によるダメージが許容されるかどうかを判断する上で充分な数値です。
The input data to the transport analysis consisted of the computed airflow around the Shuttle stack when the foam was shed, the estimated aerodynamic characteristics of the foam, the image analysis teams trajectory estimates, and the size and shape of the bipod ramp.
断熱材の軌道解析のデータには、断熱材が脱落した時点でのシャトル付近の空気の流れのコンピューターシミュレーション、断熱材の空気力学的な形状、画像解析チームによって推定された軌道、バイポッド傾斜部の形状とサイズなどが使われました。
The transport analysis team screened several of the image analysis teams location estimates, based on the feasible aerodynamic characteristics of the foam and the laws of physics. Optical distortions caused by the atmospheric density gradients associated with the shock waves off the Orbiters nose, External Tank, and Solid Rocket Boosters may have compromised the image analysis teams three position estimates closest to the bipod ramp. In addition, the image analysis teams position estimates closest to the wing were compromised by the lack of two camera views and the shock region ahead of the wing, making triangulation impossible and requiring extrapolation. However, the transport analysis confirmed that the image analysis teams estimates for the central portion of the foam trajectory were well within the computed flow field and the estimated range of aerodynamic characteristics of the foam.
軌道分析チームは、物理法則と断熱材の空気力学的な特性に基づき、画像分析チームが予測した複数の候補から断熱材が通過したと思われるいくつかの位置を選び出しました。オービターの機首や外部燃料タンク、固体燃料ロケットブースターから発生する衝撃波によって空気圧の変化し光学的な歪みが発生していたせいで、画像分析チームが行った断熱材の位置の予測は、バイポッド傾斜部付近で3カ所の候補を選び出すにとどまり、さらに主翼近辺での位置の予測はそれらの候補に基づいて推定しなければなりませんでした。しかし、画像分析チームが提示した候補のうち真ん中にあたる軌道が、断熱材の空気力学的特性とコンピューターによる空気の流れのシミュレーションの範囲にあることが軌道分析チームによって明らかになりました。
The team identified a relatively narrow range of foam im- pact velocities and ballistic coefficients. The ballistic coef- ficient of an object expresses the relative influence of weight and atmospheric drag on it, and is the primary aerodynamic characteristic of an object that does not produce lift. An object with a large ballistic coefficient, such as a cannon ball, has a trajectory that can be computed fairly accurately without accounting for drag. In contrast, the foam that struck the wing had a relatively small ballistic coefficient with a large drag force relative to its weight, which explains why it slowed down quickly after separating from the External Tank. Just prior to separation, the speed of the foam was equal to the speed of the Shuttle, about 1,568 mph (2,300 feet per second). Because of a large drag force, the foam slowed to about 1,022 mph (1,500 feet per second) in about 0.2 seconds, and the Shuttle struck the foam at a relative speed of about 545 mph (800 feet per second). (See Appendix D.8.)
分析チームは、衝突時の速度と弾道係数を比較的狭い範囲で特定しました。「弾道係数」はその物体の空気抵抗と重量に関連し、揚力を発生しない物体の主要な空気力学的特性です。弾道係数の大きな物体―たとえば大砲の玉―などは、抵抗を考慮しなくてもかなり正確に軌道を予測することが出来ます。逆に、主翼に衝突した断熱材は、その重量に対して比較的弾道係数が小さく空気抵抗が大きかったと考えられます。これは、外部燃料タンクから断熱材が脱落した直後にそのスピードが急激に落ちていることからも明らかです。脱落の直後、断熱材の速度はシャトルのスピードと同じ、約1,568mph(毎秒2,300フィート)でしたが、空気抵抗のために約0.2秒後には1,022mph(毎秒1,500フィート)まで下がり、シャトル本体との相対速度は約545mph(秒速800フィート)になっていました。(付録D8を参照)
The undetermined and yet certainly irregular shape of the foam introduced substantial uncertainty about its estimated aerodynamic characteristics. Appendix D.8 contains an in- dependent analysis conducted by the Board to confirm that the estimated range of ballistic coefficients of the foam in Figure 3.4-6 was credible, given the foam dimension results from the image analyses and the expected range of the foam density. Based on the results in Figure 3.4-7, the physical dimensions of the bipod ramp, and the sizes and shapes of the available barrels for the compressed-gas gun used in the impact test program described later in this chapter, the Board and the NASA Accident Investigation Team decided that a foam projectile 19 inches by 11.5 inches by 5.5 inches, weighing 1.67 pounds, and with a weight density of 2.4 pounds per cubic foot, would best represent the piece of foam that separated from the External Tank bipod ramp and was hit by the Orbiters left wing. See Section 3.8 for a full discussion of the foam impact testing.
不定形で形がよく分かっていない断熱材の空気力学的な特性は正確にはわかりません。付録D8には、図: 3-4-6に示された断熱材の弾道率のとりうる範囲が信頼に足るものであることを明らかにする、事故調査委員会が独自に行った別の分析結果が提示されています。これは、画像分析から得られた断熱材の形状と断熱材の密度がとりうる値に基づくものです。また、図: 3-4-7に示される結果、バイポッド傾斜部の物理的な形状、そして衝突テストで使用された圧縮ガスによる射出装置(後の章で詳しく述べます)の砲身のサイズと形状に基づいて、事故調査委員会とNASA事故調査チームは断熱材の形状を、サイズが19インチ×11.5インチ×5.5インチ、重さが1.67ポンド、重量密度が1立方メートルあたり2.4ポンドと見積もりました。これが外部燃料タンクのバイポッド傾斜部から脱落し、オービターの左主翼に衝突した断熱材の最も妥当と思われるサイズです。衝突テストについては3-8を参照してください。
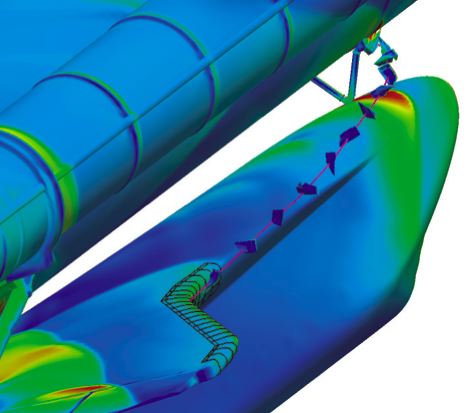
Figure 3.4-6. These are the results of a trajectory analysis that used a computational fluid dynamics approach in a program called CART-3D, a comprehensive (six-degree-of-freedom) com- puter simulation based on the laws of physics. This analysis used the aerodynamic and mass properties of bipod ramp foam, coupled with the complex flow field during ascent, to determine the likely position and velocity histories of the foam.
図3-4-6 : これらは、CART-3Dとよばれるプログラムを使った流体力学的な手法を用いた軌道分析の結果です。CART-3Dは物理法則に基づき広範な(6自由度)シミュレーションを行います。この分析では、空気力学とバイポッド傾斜部の断熱材の重量特性を用い、上昇時の複雑な空気の流れを、断熱材の位置と速度変化を割り出しました。
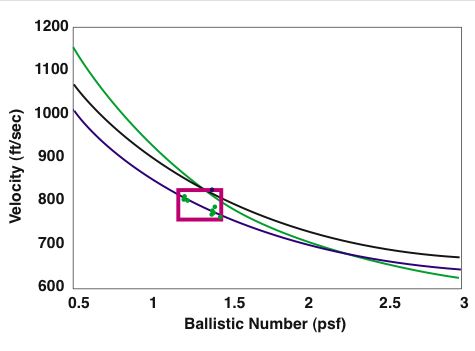
Figure 3.4-7. The results of numerous possible trajectories based on various assumed sizes, shapes, and densities of the foam. Either the foam had a slightly higher ballistic coefficient and the Orbiter struck the foam at a lower speed relative to the Orbiter, or the foam was more compact and the wing struck the foam at a higher speed. The "best fit" box represents the overlay of the data from the image analysis with the transport analysis computations. This data enabled a final selection of projectile characteristics for impact testing.
図3-4-7 : この図は、サイズや形、密度などを様々な値にとった場合の断熱材がとりうる軌道を示します。考えられるパターンは次の2つ、若干高めの弾道係数を持ち、オービターとの相対速度が低くかったか、あるいは逆にサイズが小さく(弾道係数が低く)、速いスピードで主翼に衝突したか、のドツラカだと考えられます。ここには、画像分析と軌道分析のシミュレーションによって導きだされた「最も可能性の高い領域」がデータに重ねられています。このデータは衝突テストの射出体の特性を決める為に使われました。
Findings:
所見:
F3.4-1
Photographic evidence during ascent indicates the projectile that struck the Orbiter was the left bipod ramp foam.
Photographic evidence during ascent indicates the projectile that struck the Orbiter was the left bipod ramp foam.
F3.4-1
上昇中に撮影された画像によると、主翼に衝突したのは左バイポッド傾斜部の断熱材である
上昇中に撮影された画像によると、主翼に衝突したのは左バイポッド傾斜部の断熱材である
F3.4-2
The same photographic evidence, confirmed by independent analysis, indicates the projectile struck the underside of the leading edge of the left wing in the vicinity of RCC panels 6 through 9 or the tiles directly behind, with a velocity of approximately 775 feet per second.
The same photographic evidence, confirmed by independent analysis, indicates the projectile struck the underside of the leading edge of the left wing in the vicinity of RCC panels 6 through 9 or the tiles directly behind, with a velocity of approximately 775 feet per second.
F3.4-2
断熱材は左翼前縁部の下側、RCCパネル6番から9番ないしそのすぐ後ろの耐熱タイルに、およそ秒速775フィート毎秒の速度で衝突したと考えられる。これは、F-3.4-2と同じ画像に対して別の分析を行った結果判明した。
断熱材は左翼前縁部の下側、RCCパネル6番から9番ないしそのすぐ後ろの耐熱タイルに、およそ秒速775フィート毎秒の速度で衝突したと考えられる。これは、F-3.4-2と同じ画像に対して別の分析を行った結果判明した。
F3.4-3
There is a requirement to obtain and downlink on-board engineering quality imaging from the Shuttle during launch and ascent.
There is a requirement to obtain and downlink on-board engineering quality imaging from the Shuttle during launch and ascent.
F3.4-3
今後、打ち上げ時及び上昇時にシャトルに搭載された工学的な評価に耐えうるクオリティの映像を取得し、シャトルから地上局へ送信できる方法を確保する必要がある。
今後、打ち上げ時及び上昇時にシャトルに搭載された工学的な評価に耐えうるクオリティの映像を取得し、シャトルから地上局へ送信できる方法を確保する必要がある。
F3.4-4
The current long-range camera assets on the Ken- nedy Space Center and Eastern Range do not pro- vide best possible engineering data during Space Shuttle ascents.
The current long-range camera assets on the Ken- nedy Space Center and Eastern Range do not pro- vide best possible engineering data during Space Shuttle ascents.
F3.4-4
ケネディ宇宙センターと東部エリアに設置された現状の望遠カメラからは、スペースシャトル上昇時の最適な工学的データが得られていない。
ケネディ宇宙センターと東部エリアに設置された現状の望遠カメラからは、スペースシャトル上昇時の最適な工学的データが得られていない。
F3.4-5
Evaluation of STS-107 debris impact was ham- pered by lack of high resolution, high speed cam- eras (temporal and spatial imagery data).
Evaluation of STS-107 debris impact was ham- pered by lack of high resolution, high speed cam- eras (temporal and spatial imagery data).
F3.4-5
STS-107の破片衝突の調査は、高解像度、高速度撮影カメラ(時間的、空間的な情報が得られる画像データ)が存在しなかったために難航した。
STS-107の破片衝突の調査は、高解像度、高速度撮影カメラ(時間的、空間的な情報が得られる画像データ)が存在しなかったために難航した。
F3.4-6
Despite the lack of high quality visual evidence, the information available about the foam impact during the mission was adequate to determine its effect on both the thermal tiles and RCC.
Despite the lack of high quality visual evidence, the information available about the foam impact during the mission was adequate to determine its effect on both the thermal tiles and RCC.
F3.4-6
高品質の映像データが得られなかったものの、ミッション中の断熱材の衝突に関する情報により、断熱材の衝突が耐熱タイル及びRCCパネルに対してなんらかの影響を与えたことが明らかになった。
高品質の映像データが得られなかったものの、ミッション中の断熱材の衝突に関する情報により、断熱材の衝突が耐熱タイル及びRCCパネルに対してなんらかの影響を与えたことが明らかになった。
Recommendations:
勧告:
R3.4-1
Upgrade the imaging system to be capable of providing a minimum of three useful views of the Space Shuttle from liftoff to at least Solid Rocket Booster separation, along any expected ascent azimuth. The operational status of these assets should be included in the Launch Commit Cri- teria for future launches. Consider using ships or aircraft to provide additional views of the Shuttle during ascent.
Upgrade the imaging system to be capable of providing a minimum of three useful views of the Space Shuttle from liftoff to at least Solid Rocket Booster separation, along any expected ascent azimuth. The operational status of these assets should be included in the Launch Commit Cri- teria for future launches. Consider using ships or aircraft to provide additional views of the Shuttle during ascent.
R3.4-1
打ち上げから少なくとも固体燃料ロケットブースターの切り離しまでの間、最低3方向からスペースシャトルを有効視界に捉えられるように映像システムをアップグレードすること。今後この映像システムの運用状態が「打ち上げ基準」に含まれるべきである。また、船舶や航空機から上昇中のシャトルを映像におさめることも検討すること。
打ち上げから少なくとも固体燃料ロケットブースターの切り離しまでの間、最低3方向からスペースシャトルを有効視界に捉えられるように映像システムをアップグレードすること。今後この映像システムの運用状態が「打ち上げ基準」に含まれるべきである。また、船舶や航空機から上昇中のシャトルを映像におさめることも検討すること。
R3.4-2
Provide a capability to obtain and downlink high- resolution images of the External Tank after it separates.
Provide a capability to obtain and downlink high- resolution images of the External Tank after it separates.
R3.4-2
切り離し後の外部燃料タンクの高解像度の画像をシャトルから地上局へ送信する方法を提供すること。
切り離し後の外部燃料タンクの高解像度の画像をシャトルから地上局へ送信する方法を提供すること。
R3.4-3
Provide a capability to obtain and downlink high- resolution images of the underside of the Orbiter wing leading edge and forward section of both wingsThermal Protection System.
Provide a capability to obtain and downlink high- resolution images of the underside of the Orbiter wing leading edge and forward section of both wingsThermal Protection System.
R3.4-3
オービターの両翼の前縁部および翼前部の耐熱システムの下部を高解像度で撮影し、そのデータをシャトルから地上局へ送信する方法を提供すること。
オービターの両翼の前縁部および翼前部の耐熱システムの下部を高解像度で撮影し、そのデータをシャトルから地上局へ送信する方法を提供すること。
THE ORBITER "RAN INTO" THE FOAM