3.6 DE-ORBIT/RE-ENTRY
3.6 De-Orbit/Re-Entry
―軌道離脱/再突入―
―軌道離脱/再突入―
As Columbia re-entered Earths atmosphere, sensors in the Orbiter relayed streams of data both to entry controllers on the ground at Johnson Space Center and to the Modular Auxiliary Data System recorder, which survived the breakup of the Orbiter and was recovered by ground search teams. This data ュ temperatures, pressures, and stresses ュ came from sensors located throughout the Orbiter. Entry control- lers were unaware of any problems with re-entry until telem- etry data indicated errant readings. During the investigation data from these two sources was used to make aerodynamic, aerothermal, and mechanical reconstructions of re-entry that showed how these stresses affected the Orbiter.
コロンビアが大気圏に突入する時には、オービターのセンサーはデータを次の2ヶ所に送信していました。ジョンソン宇宙センターの地上再突入管制室とオービターに搭載された補助データシステムモジュール(MADS: Modular Auxiliary Data System)のレコーダーです。この補助データシステムモジュールのレコーダーはオービターの空中分解に耐え、地上捜索チームによって回収されました。これらの場所に記録された温度、圧力、応力のそれぞれのデータは、オービターの各部のセンサーから送られてきたものです。再突入時、管制室は送信されてきたデータが異常な数値を示すまで問題に気づきませんでした。調査が進められる中で、これらのデータから、空気力学的、工学的に再突入時の状態が再現され、各部にかかった負荷がオービターにどのような影響を与えたかを明らかにしました。
The re-entry analysis and testing focused on eight areas:
再突入の分析とそれに関連するテストが注力した8つの分野は以下の通り:
1. Analysis of the Modular Auxiliary Data System re- corder information and the pattern of wire runs and sensor failures throughout the Orbiter.
2. Physical and chemical analysis of the recovered de- bris to determine where the breach in the RCC panels likely occurred.
3. Analysis of videos and photography provided by the general public.
4. Abnormal heating on the outside of the Orbiter body. Sensors showed lower heating and then higher heating than is usually seen on the left Orbital Maneuvering System pod and the left side of the fuselage.
5. Early heating inside the wing leading edge. Initially, heating occurred inside the left wing RCC panels be- fore the wing leading edge spar was breached.
6. Laterheatinginsidetheleftwingstructure.Thisanaly- sis focused on the inside of the left wing after the wing leading edge spar had been breached.
7. Early changes in aerodynamic performance. The Or- biterbeganreactingtoincreasingleftyawandleftroll, consistent with developing drag and loss of lift on the left wing.
8. Later changes in aerodynamic performance. Almost 600 seconds after Entry Interface, the left-rolling ten- dency of the Orbiter changes to a right roll, indicating an increase in lift on the left wing. The left yaw also increased, showing increasing drag on the left wing.
1. 補助データシステムモジュールのレコーダーに記録された情報およびオービター内の配線とセンサーの機能停止のパターンの分析。
2. 損傷が起きたRCCパネルの箇所を特定するための、回収された破片の物理的、化学的分析。
3. 一般の人々から提供された写真やビデオ映像の分析。
4. オービターの胴体外部の異常加熱。左軌道制御システム(Orbital Maneuvering System)収納部および胴体の左側が、最初に通常より低い温度を示し、次いで通常より高い数値を示した。
5. 主翼前縁部の初期の加熱。主翼前縁部桁が損傷した箇所の前方のRCCパネルの内側で最初の温度上昇が起きている。
6. それに続く左翼内部の加熱。主翼前縁部桁の損傷後の左翼内部の状況について
7. 初期の空気力学的特性の変化。左翼の揚力の低下と空気抵抗の増加にともなって、オービターが左ヨー角、左ロール角を増加させた。
8.それに続く空気力学的特性の変化。再突入開始時間から約600秒後、それまで左ロールする傾向にあったオービターが右ロールを始めている。これは左翼の揚力が増加したことを示す。また、左ヨー角が増加しており、左翼の空気抵抗が上がっていることを示す。
For a complete compilation of all re-entry data, see the CAIB/NAIT Working Scenario (Appendix D.7) and the Re- entry Timeline (Appendix D.9). The extensive aerothermal calculations and wind tunnel tests performed to investigate the observed re-entry phenomenon are documented in NASAreport NSTS-37398.
再突入時の完全なデータについては、CAIB/NAIT Working Scenario (Appendix D.7)とRe-entry Timeline (Appendix D.9)を参照して下さい。再突入時に起きる現象を調査するために行われた、さらに広範囲に及ぶ空力加熱の解析と風洞実験の結果はNASAレポートのNSTS-37398(訳注: Appendix Gに収録の"Aero/Aerothermal/Thermal/Structures Team Final Report")にまとめられています。
Re-Entry Environment
再突入時の環境
In the demanding environment of re-entry, the Orbiter must withstand the high temperatures generated by its movement through the increasingly dense atmosphere as it deceler- ates from orbital speeds to land safely. At these velocities, shock waves form at the nose and along the leading edges of the wing, intersecting near RCC panel 9. The interac- tion between these two shock waves generates extremely high temperatures, especially around RCC panel 9, which experiences the highest surface temperatures of all the RCC panels. The flow behind these shock waves is at such a high temperature that air molecules are torn apart, or "dissoci- ated." The air immediately around the leading edge surface can reach 10,000 degrees Fahrenheit; however, the boundary layer shields the Orbiter so that the actual temperature is only approximately 3,000 degrees Fahrenheit at the leading edge. The RCC panels and internal insulation protect the alumi- num wing leading edge spar.A breach in one of the leading- edge RCC panels would expose the internal wing structure to temperatures well above 3,000 degrees Fahrenheit.
再突入時、オービターは軌道速度から安全に着陸できる速度まで減速していくにしたがって徐々に濃くなっていく大気の中を通過する際に発生する高熱に耐えなければなりません。この減速中に機首と主翼の前縁部から衝撃波が発生します。この2つの衝撃波は9番RCCパネル付近でぶつかり合います。衝撃波同士の相互作用は非常な高温を生み出し、9判RCCパネルの表面温度は他のRCCパネルと比べてとくに高い温度になります。このような温度では、衝撃波の内側の大気は空気の分子がバラバラの分離した状態になります。主翼前縁部のすぐ近くの空気は華氏10,000度(約5500℃)にも達します。ただし、オービターを取り巻く空気の層が熱を遮断するため主翼前縁部そのものの表面は摂氏3,000度(約1650℃)程度です。RCCパネルと内部の断熱材が、アルミニウムの主翼前縁部桁を保護しています。RCCパネルのどれかに破損があれば、主翼の内部構造が摂氏3,000度(約1650℃)を越える温度に曝されることになります。
In contrast to the aerothermal environment, the aerodynamic environment during Columbias re-entry was relatively benign, especially early in re-entry.The re-entry dynamic pres- sure ranged from zero at Entry Interface to 80 pounds per square foot when the Orbiter went out of control, compared with a dynamic pressure during launch and ascent of nearly 700 pounds per square foot. However, the aerodynamic forces were increasing quickly during the final minutes of Columbias flight, and played an important role in the loss of control.
このように激しい熱的環境に比べて、コロンビアの再突入時の空力的な環境は特に初期段階では比較的穏やかでした。再突入時にオービターにかかっていた動的な圧力は再突入開始時間(EI:エントリーインターフェイス)ではゼロで、コントロール不能になったときには一平方フィートあたり80ポンドになっていました(ちなみに、打ち上げ時の圧力は1平方フィートあたり700ポンドに達します)。とはいえ、コロンビアの最後の数分間に空力的な影響は急激に増しており、コントロール不能に至る重要な役割を果たしました。
Orbiter Sensors
オービターに搭載されたセンサー
The Operational Flight Instrumentation monitors physical sensors and logic signals that report the status of various Orbiter functions. These sensor readings and signals are telemetered via a 128 kilobit-per-second data stream to the Mission Control Center, where engineers ascertain the real- time health of key Orbiter systems. An extensive review of this data has been key to understanding what happened to STS-107 during ascent, orbit, and re-entry.
飛行制御装置は物理的なセンサーとオービターの様々な機能の状態を伝える信号をモニターしています。これらのセンサーの値と信号は毎秒129Kバイトでミッションコントロールセンタ−へ送信され、エンジニアがオービターのシステムの状態をリアルタイムで確認しています。これらのデータを詳しく再確認することで、上昇中、軌道上、再突入時にSTS-107で起きたことについて理解するカギとなりました。
The Modular Auxiliary Data System is a supplemental instrumentation system that gathers Orbiter data for pro- cessing after the mission is completed. Inputs are almost exclusively physical sensor readings of temperatures, pres- sures, mechanical strains, accelerations, and vibrations. The Modular Auxiliary Data System usually records only the missions first and last two hours (see Figure 3.6-1).
補助データシステムモジュール(Modular Auxiliary Data System)は、ミッション終了後にオービターの飛行データを収集するための補助的なシステムです。集められるデータは、温度・圧力・応力・加速度・振動などの物理的なセンサーの数値だけです。補助データシステムモジュールは通常、ミッションの最初と最後の2時間ずつだけデータを記録します(図:3-6-1)。
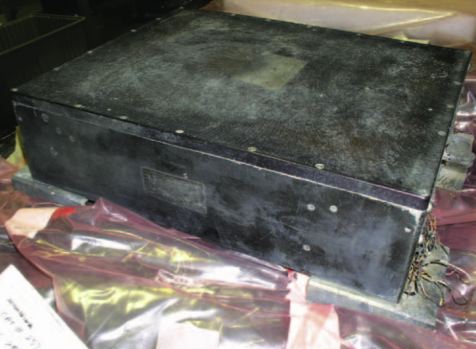
Figure 3.6-1. The Modular Auxiliary Data System recorder, found near Hemphill, Texas. While not designed to withstand impact damage, the recorder was in near-perfect condition when recov- ered on March 19, 2003.
図3-6-1: テキサス州、ヘンプヒル近郊で発見された補助データシステムモジュールのレコーダー。発見されたのは2003年3月19日。衝突に耐えるように設計されていなかったにもかかわらず、レコーダーはほぼ完全な状態で発見されました。
The Orbiter Experiment instrumentation is an expanded suite of sensors for the Modular Auxiliary Data System that was installed on Columbia for engineering development purposes. Because Columbia was the first Orbiter launched, engineering teams needed a means to gather more detailed flight data to validate their calculations of conditions the vehicle would experience during critical flight phases. The instrumentation remained on Columbia as a legacy of the development process, and was still providing valuable flight data from ascent, de-orbit, and re-entry for ongoing flight analysis and vehicle engineering. Nearly all of Columbias sensors were specified to have only a 10-year shelf life, and in some cases an even shorter service life.
オービター実験用計測機器は補助データシステムモジュールの一連のセンサー群を拡張したもので、技術的な開発を目的としてコロンビアに組み込まれました。コロンビアは最初に打ち上げられたオービターだったので、実際のフライトでオービターが曝される条件を予測した数値が正しかったかどうかを判断するために、飛行の主要フェイズでの飛行データを詳細に取得する必要があったのです。これらの計測器は開発段階の遺産として残されていたものでしたが、未だに、上昇時・軌道離脱時・再突入時の有用なデータを提供し続けています。コロンビアに搭載されたほとんどのセンサーの寿命は10年程度か、もっと短い耐用年数しか持っていないとされていました。
At 22 years old, the majority of the Orbiter Experiment in- strumentation had been in service twice as long as its speci- fied service life, and in fact, many sensors were already failing. Engineers planned to stop collecting and analyzing data once most of the sensors had failed, so failed sensors and wiring were not repaired. For instance, of the 181 sensors in Columbias wings, 55 had already failed or were producing questionable readings before STS-107 was launched.
現在、製造から22年経ち、かなりのオービターの実験機材が耐用年数の2倍以上使用され、実際多くのセンサーがすでに機能を停止しています。技術者たちは、ほとんどのセンサーが機能を停止したらデータの収集をやめようと考えていました。そのため、機能を停止したセンサーや配線は修理されることがなかったのです。たとえば、STS-107打ち上げ前の段階でコロンビアの主翼に181ヵ所設置されたセンサーのうち、55のセンサーは機能を停止するないし、正しいデータを送信していませんでした。
Re-Entry Timeline
再突入時のタイムライン
Times in the following section are noted in seconds elapsed from the time Columbia crossed Entry Interface (EI) over the Pacific Ocean at 8:44:09 a.m. EST. Columbias destruc- tion occurred in the period from Entry Interface at 400,000 feet (EI+000) to about 200,000 feet (EI+970) over Texas. The Modular Auxiliary Data System recorded the first indications of problems at EI plus 270 seconds (EI+270). Because data from this system is retained onboard, Mission Control did not notice any troubling indications from telem- etry data until 8:54:24 a.m. (EI+613), some 10 minutes after Entry Interface.
以下のセクションでは、一連のイベントが起きた時間をコロンビアがエントリーインターフェイス(EI : Entry Intarface) - 再突入開始地点を通過してからの経過時間(秒)で表します。コロンビアは東部標準時(EST)午前8:44:09に太平洋上空でエントリーインターフェイスを通過しました。コロンビアの破壊は高度400,000フィートのエントリーインターフェイス(EI+000)から、テキサス州上空、高度約200,000フィート(EI+270)までに始まりました。補助データシステムモジュールのデータには、最初の問題の兆候がEIから270秒経過した地点(EI+270)で記録されています。このデータは機体内に保存されたため、ミッションコントロールセンターではエントリーインターフェイスから約10分後の8:54:24 a.m(EI+613)までトラブルの兆候を掴むことができませんでした。
Left Wing Leading Edge Spar Breach (EI+270 through EI+515)
左翼前縁部桁の損傷 (EI+270 〜 EI+515)
At EI+270, the Modular Auxiliary Data System recorded the first unusual condition while the Orbiter was still over the Pacific Ocean. Four sensors, which were all either inside or outside the wing leading edge spar near Reinforced Car- bon-Carbon (RCC) panel 9-left, helped tell the story of what happened on the left wing of the Orbiter early in the re-entry. These four sensors were: strain gauge V12G9921A (Sensor 1), resistance temperature detector V09T9910Aon the RCC clevis between panel 9 and 10 (Sensor 2), thermocouple V07T9666A, within a Thermal Protection System tile (Sen- sor 3), and resistance temperature detector V09T9895A (Sensor 4), located on the back side of the wing leading edge spar behind RCC panels 8 and 9 (see Figure 3.6-2).
EI+270の時点で、補助データシステムモジュールが最初の異常を記録しています。このときシャトルはまだ太平洋上空を飛行していました。9番強化カーボン-カーボン-カーボン(RCC)パネル付近、左翼前縁部桁の内側と外側に設置された4つのセンサーが、大気圏突入の初期段階にシャトルに何が起きていたかを教えてくれます。4つのセンサーの構成は以下の通り、応力ゲージ V12G9921A (センサー1)、9番と10番RCCパネルの接続部に設置された抵抗温度計 (温度センサー) V09T9910A (センサー2)、耐熱タイルに埋め込まれた熱電対(温度センサー) V07T966A (センサー3)、8番および9番RCCパネル直後の主翼前縁部桁背面に設置された抵抗温度計 V09T9895A (図: 3-6-2参照)。
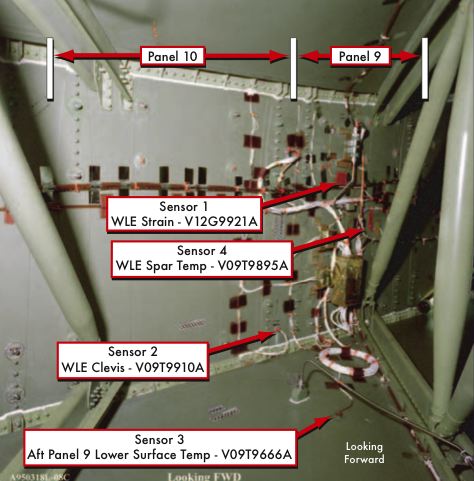
Figure 3.6-2. Location of sensors on the back of the left wing lead- ing edge spar (vertical aluminum structure in picture). Also shown are the round truss tubes and ribs that provided the structural support for the mid-wing in this area.
図3-6-2: 左主翼前縁部桁(画像中で縦に走っているアルミの構造物)の背面に設置されたセンサーの位置を示します。また、このエリアの主翼中央部を構造的に支える円筒形のトラスチューブとリブが見えます。
Sensor 1 provided the first anomalous reading (see Figure 3.6-3). From EI+270 to EI+360, the strain is higher than that on previous Columbia flights.At EI+450, the strain reverses, and then peaks again in a negative direction at EI+475. The strain then drops slightly, and remains constant and negative until EI+495, when the sensor pattern becomes unreliable, probably due to a propagating soft short, or "burn-through" of the insulation between cable conductors caused by heating or combustion.This strain likely indicates significant damage to the aluminum honeycomb spar. In particular, strain reversals, which are unusual, likely mean there was significant high-temperature damage to the spar during this time.
最初に異常な数値を示したのはセンサー1でした(図:3-6-3)。EI+270からEI+360までの間、応力がこれまでのコロンビアのフライトより高い数値を示していました。さらに、EI+450の時点で応力の向きは逆になり、 El+475でピークを示します。その後、応力の値は若干下がり、El+495まで負の値を示し続けました。これ以降センサーの数値が示すパターンは信頼できるものでは無くなりました。おそらくケーブルの導線の間にある絶縁体が熱か酸化のために焼き切れたかショートしたのでしょう。この応力の値はアルミハニカム製の桁に重大なダメージが生じていたことを示しています。特に、通常ではあり得ない応力の逆転が起きていることから、この時点で高温によるかなりの損傷があったと考えられます。
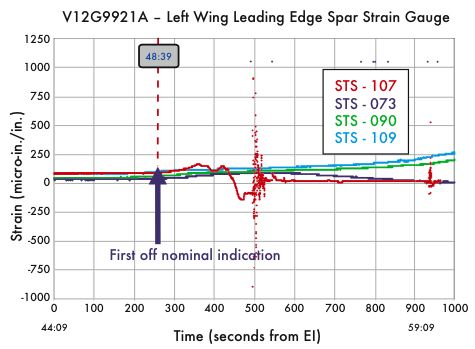
Figure 3.6-3. The strain gauge (Sensor 1) on the back of the left wing leading edge spar was the first sensor to show an anomalous reading. In this chart, and the others that follow, the red line indi- cates data from STS-107. Data from other Columbia re-entries, simi- lar to the STS-107 re-entry profile, are shown in the other colors.
図3-6-3: 左翼前縁部桁の背面に設置された応力ゲージ (センサー1)が最初に異常な数値を示しました。このチャート及びこれ以後示すチャートには、STS-107の数値が赤色で記されています。また、それ以前のコロンビアの再突入時のデータ(STS-107に飛行特性が似ているもの)が他の色で記されています。
At EI+290, 20 seconds after Sensor 1 gave its first anoma- lous reading, Sensor 2, the only sensor in the front of the left wing leading edge spar, recorded the beginning of a gradual and abnormal rise in temperature from an expected 30 degrees Fahrenheit to 65 degrees at EI+493, when it then dropped to "off-scale low," a reading that drops off the scale at the low end of the sensors range (see Figure 3.6-4). Sen- sor 2, one of the first to fail, did so abruptly. It had indicated only a mild warming of the RCC attachment clevis before the signal was lost.
EI-290の時点、センサー1が最初に異常な数値を示した20秒後、センサー2が最初の異常な数値を示しました。このセンサーは唯一左主翼前縁部の前方につけられています。数値はこの時点から徐々に異常な上昇を示しており、EI+493までに華氏30度(約-1℃)から65度(約18℃)まで上がっています。 この直後、数値は「読み取り不能」になりました。つまり、センサーが検知できる値の最小値より数値が低くなってしまったのです。センサー2は最初に機能しなくなったセンサーで、機能喪失は突然起こりました。これらのデータは、信号が失われたときにRCCパネルを接続しているリンクが徐々に暖かくなっていたことを示しています。
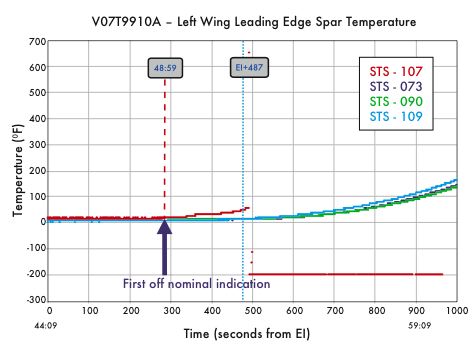
Figure 3.6-4. This temperature thermocouple (Sensor 2) was mounted on the outside of the wing leading edge spar behind the insulation that protects the spar from radiated heat from the RCC panels. It clearly showed an off-nominal trend early in the re-entry sequence and began to show an increase in temperature much earlier than the temperature sensor behind the spar.
図3-6-4: この温度センサー(センサ−2)は、左翼前縁部桁の外側、RCCパネルの熱から桁を保護するための断熱材のすぐ後ろに設置されています。このセンサーは、大気圏突入の再初期の段階で異常を示し、主翼桁の後ろに設置されたセンサーよりも早い段階で、数値が徐々に上昇しています。
A series of thermal analyses were performed for different sized holes in RCC panel 8 to compute the time required to heat Sensor 2 to the temperature recorded by the Modular Auxiliary Data System. To heat the clevis, various insulators would have to be bypassed with a small amount of leakage, or "sneak flow." Figure 3.6-5 shows the results of these calculations for, as an example, a 10-inch hole, and demonstrates that with sneak flow around the insulation, the temperature profile of the clevis sensor was closely matched by the engineering calculations. This is consistent with the same sneak flow required to match a similar but abnormal ascent temperature rise of the same sensor, which further supports the premise that the breach in the leading edge of the wing occurred during ascent. While the exact size of the breach will never be known, and may have been smaller or larger than 10 inches, these analyses do provide a plausible explanation for the observed rises in temperature sensor data during re-entry.
8番RCCパネルに開いた穴の大きさと、センサー2が補助データシステムモジュールに記録された温度まで暖まるのにかかる時間との関係を調べるために、熱的な解析が行われました。リンクが暖められるためには、(高熱のガスが)断熱材を迂回してごくわずかに漏れだす必要があります。図3-6-5にこれらの分析のうち、RCCパネルに10インチ(約25cm)の穴があき、断熱材の周囲から高熱のガスが漏れだした場合の例を示します。この分析結果はリンクに設置されたセンサーの値によく似ており、センサーが記録した異常な温度の上昇と矛盾しません。これは、シャトルの上昇中に主翼の前縁部が破損したとする仮説を支持するものです。実際の穴がどれくらいのサイズだったかは分かりませんが、おそらく10インチ前後だったと思われます。この分析は、再突入時に温度センサーが記録した温度の上昇を十分に説明しうるものです。
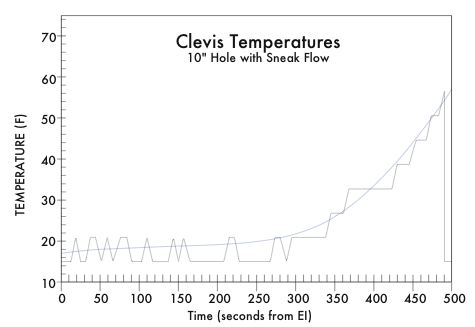
Figure 3.6-5. The analysis of the effect of a 10-inch hole in RCC panel 8 on Sensor 2 from EI to EI+500 seconds. The jagged line shows the actual flight data readings and the smooth line the calculated result for a 10-inch hole with some sneak flow of super- heated air behind the spar insulation.
図3-6-5: この分析結果はRCCパネルに10インチ(約25cm)の穴があいた場合に、EIからEI+500までにセンサー2が記録すると思われる温度変化を示します。ギザギザの線は実際の飛行時のデータを、スムーズなラインは分析によるデータを表しています。分析はRCCパネルに10インチの穴が開き、主翼桁の裏側に徐々に高熱の空気が漏れだしたと仮定して行いました。
Investigators initially theorized that the foam might have broken a T-seal and allowed superheated air to enter the wing between the RCC panels. However, the amount of T-seal debris from this area and subsequent aerothermal analysis showing this type of breach did not match the observed damage to the wing, led investigators to eliminate a missing T-seal as the source of the breach.
調査員達は当初、断熱材の破片はT-シールを破壊し、高熱の空気がRCCパネルの間から侵入したと考えました。しかし、このエリアのT-シールの破片のサイズと後で述べる空力加熱についての分析から、このタイプの損傷は主翼に生じたダメージと一致しないことが明らかになり、失われたT-シールは損傷の原因から外されました。
Although abnormal, the re-entry temperature rise was slow and small compared to what would be expected if Sensor 2 were exposed to a blast of superheated air from an assumed breach in the RCC panels. The slow temperature rise is attributed to the presence of a relatively modest breach in the RCC, the thick insulation that surrounds the sensor, and the distance from the site of the breach in RCC panel 8 to the clevis sensor.
確かに異常なものでしたが、もしセンサ−2がRCCパネルの破損箇所からの高熱の空気に激しく曝されたとすると、再突入時の温度の上昇はあまりに緩やかで、その量もわずかでした。緩やかな温度上昇はRCCパネルの損傷が比較的小さかったこと、厚い断熱材がセンサーを取り囲んでいたこと、そしてRCCパネル8の損傷部分がセンサーから離れていたことを示唆しています。
The readings of Sensor 3, which was in a thermal tile, began rising abnormally high and somewhat erratically as early as EI+370, with several brief spikes to 2,500 degrees Fahrenheit, significantly higher than the 2,000-degree peak temperature on a normal re-entry (Figure 3.6-6).At EI+496, this reading became unreliable, indicating a failure of the wire or the sensor. Because this thermocouple was on the wing lower surface, directly behind the junction of RCC panel 9 and 10, the high temperatures it initially recorded were almost certainly a result of air jetting through the dam- aged area of RCC panel 8, or of the normal airflow being disturbed by the damage. Note that Sensor 3 provided an external temperature measurement, while Sensors 2 and 4 provided internal temperature measurements.
耐熱タイルの内部に埋め込まれたセンサー3は、EI+370ですでに驚くほど高い温度を示していました。温度の変化は不規則で、瞬間的には華氏2,500度にも達していたのです。これは通常の再突入時の華氏2,000を大きく越えています。EI+496の時点で数値は信憑性がなくなりました。これは、配線ないしセンサーそのものが機能を喪失したことを示します。この温度センサーは、主翼の下面、9番と10番のRCCパネルの接合面の直後に設置されています。そのため、この温度上昇は8番RCCパネルの損傷部分からの空気の噴出か、もしくは損傷によって変化した空気の流れによるものと考えられます。センサー2やセンサー4が内部の温度を計測しているのに対し、このセンサー3が外部の温度を計測していることに注意して下さい。
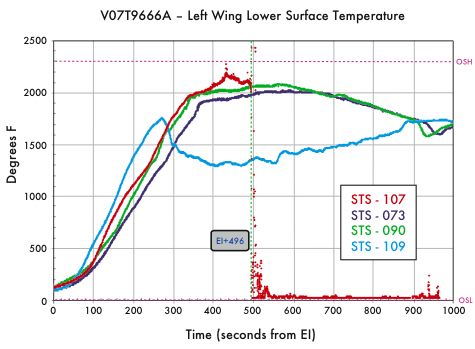
Figure 3.6-6. As early as EI+370, Sensor 3 began reading sig- nificantly higher than on previous flights. Since this sensor was located in a thermal tile on the lower surface of the left wing, its temperatures are much higher than those for the other sensors.
図3-6-6: EI+370で既にセンサー3は通常のフライトより高い温度を示しています。このセンサーは左翼の下面の耐熱タイルに設置されているため、他のセンサーよりも高い数値を示しています。
Sensor 4 also recorded a rise in temperature that ended in an abrupt fall to off-scale low. Figure 3.6-7 shows that an ab- normal temperature rise began at EI+425 and abruptly fell at EI+525. Unlike Sensor 2, this temperature rise was extreme, from an expected 20 degrees Fahrenheit at EI+425 to 40 de- grees at EI+485, and then rising much faster to 120 degrees at EI+515, then to an off-scale high (a reading that climbs off the scale at the high end of the range) of 450 degrees at EI+522. The failure pattern of this sensor likely indicates destruction by extreme heat.
センサー4も同じく温度の上昇を捉えていましたが、やはり突然数値が読み取り不能になりました。図3-6-7に示すように、異常な温度上昇はEI+425から始まり、EI+525に突然数値が低下します。センサー2の場合と違い、この温度上昇はかなり急激でした。EI+425の時点では華氏20度だったものがEI+485では華氏40度に、更に急激に上昇してEl+515では華氏120度に、そしてEI+522には華氏450度まで上昇し読み取り不能になりました(値が読み取り範囲を超えて上昇)。この値の変化は、このセンサーが高熱によって破壊されたことを示しています。
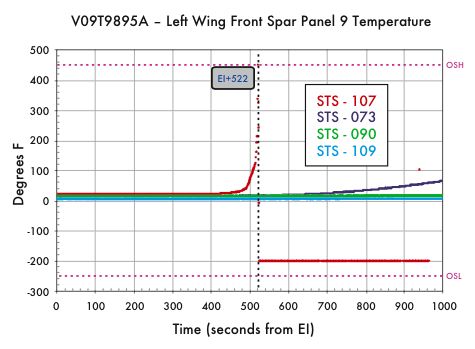
Figure 3.6-7. Sensor 4 also began reading significantly higher than previous flights before it fell off-scale low. The relatively late reaction of this sensor compared to Sensor 2, clearly indicated that superheated air started on the outside of the wing leading edge spar and then moved into the mid-wing after the spar was burned through. Note that immediately before the sensor (or the wire) fails, the temperature is at 450 degrees Fahrenheit and climbing rapidly. It was the only temperature sensor that showed this pattern.
図3-6-7: センサー4も他のセンサーと同じく、読み取り不能になる直前にこれまでのフライトと比べて非常に高い温度を示しました。センサー2に比べて、このセンサーへの影響が遅れていることから、高熱の空気が主翼前縁部桁の前方から、桁を焼き切って主翼内部に侵入したことが分かります。センサーないし配線が機能を失う寸前、温度が華氏450度まで急激に上昇していることに注意して下さい。このパターンを示したのはこのセンサーだけです。
The timing of the failures of these four sensors and the path of their cable routing enables a determination of both the timing and location of the breach of the leading edge spar, and indirectly, the breach of the RCC panels. All the cables from these sensors, and many others, were routed into wir- ing harnesses that ran forward along the back side of the leading edge spar up to a cross spar (see Figure 3.6-8), where they passed through the service opening in the cross spar and then ran in front of the left wheel well before reaching interconnect panel 65P, where they entered the fuselage. All sensors with wiring in this set of harnesses failed between EI+487 to EI+497, except Sensor 4, which survived until EI+522. The diversity of sensor types (temperature, pres- sure, and strains) and their locations in the left wing indi- cates that they failed because their wiring was destroyed at spar burn-through, as opposed to destruction of each individual sensor by direct heating.
これら4つのセンサーの機能喪失のタイミングと、ケーブルが設置されていた経路から、主翼前縁部桁の破損がいつどこから始まったかを明らかにすることができます。そして、このことからRCCパネルの破損箇所がどこにあったかを間接的に把握することができるでしょう。これらのセンサーのケーブルは、他のセンサーのものと同じようにハーネスに納められて、主翼前縁部桁の裏側を交差方向の縦桁まで走っています。このケーブル類は、縦桁に開けられた整備用の穴をくぐり抜け、左主着陸脚収納部の前を通って、相互接続パネルの65Pに接続され、そこから胴体内に導かれます。この一連のハーネスに接続されたセンサーは、EI+522まで生きていたセンサー4を除いて、全てEI+487からEI+497の間に機能を喪失しました。これらのセンサーに様々なタイプ(温度、圧力、応力)が混ざっており、左翼の広い範囲に分布していたことから、個々のセンサーが直接熱によって破壊されたのではなく、桁が焼き切れた際にこれらの配線が破壊されたと考えられます。
Examination of wiring installation close out photographs (pictures that document the state of the area that are normally taken just before access is closed) and engineering drawings show five main wiring harness bundles running forward along the spar, labeled top to bottom as A through E (see Figure 3.6-8). The top four, A through D, are spaced 3 inches apart, while the fifth, E, is 6 inches beneath them.The separation between bundle E and the other four is consistent with the later fail- ure time of Sensor 4 by 25 to 29 seconds, and indicates that the breach was in the upper two-thirds of the spar, causing all but one of the cables in this area to fail between EI+487 to EI+497. The breach then expanded vertically, toward the underside of the wing, causing Sensor 4 to fail 25 seconds later. Because the distance between bundle A and bundle E is 9 inches, the failure of all these wires indicates that the breach in the wing leading edge spar was at least 9 inches from top to bottom by EI+522 seconds.
ケーブルの配置を記録したハッチ閉鎖前の写真(通常、整備用のアクセスハッチが閉じられる直前に、該当部分の状態を記録しておくために撮影されるもの)と設計図によると、主要なケーブルは上から順にAからEまでラベル付けされた五本のハーネスに束ねられ、梁に沿って前方へと走っています(図3-6-8)。上から4本、AからDまでのハーネスは3インチ幅で設置され、5番目のEはさらにその6インチ下に設置されています。ハーネスEとその他の4本のハーネスの距離は、他のものから25から29秒遅れたセンサー4の機能喪失のタイミングと一致します。このことから、破損箇所は梁の2/3の位置から始まり、EI+487からEI+497の間に4本のケーブルを焼き切った後、下向き、縦方向に広がり25秒後にセンサー4の機能喪失を引き起こしたと考えられます。また、ハーネスAからハーネスEまでが9インチあることから、全てのセンサーが機能喪失したEI+522の時点で、主翼前縁部桁の損傷は少なくとも9インチあったと思われます。
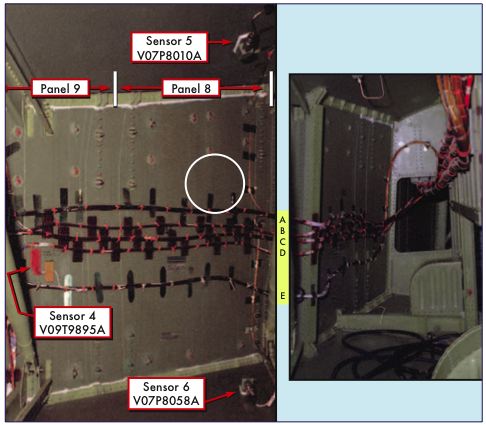
Figure 3.6-8. The left photo above shows the wiring runs on the backside of the wing leading edge behind RCC panel 8 - the cir- cle marks the most likely area where the burn through of the wing leading edge spar initially occurred at EI+487 seconds. The right photo shows the wire bundles as they continue forward behind RCC panels 7 and 6. The major cable bundles in the upper right of the right photo carried the majority of the sensor data inside the wing. As these bundles were burned, controllers on the ground began seeing off-nominal sensor indications.
図3-6-8: 左の写真は、8番RCCパネル後ろの主翼前縁部桁の背面をケーブルが走っている様子を示します。写真中円で示されているのが、EI+487に桁が最初に焼き切れたと思われる場所です。右の写真は、7番および6番RCCパネル後ろの様子です。写真中右上に見えるケーブルは主翼に設置されたほとんどのセンサーからのデータを集めるものです。これらのケーブルが焼き切れたことで、地上の管制官がセンサーの異常に気づくことになりました。
Also directly behind RCC panel 8 were pressure sensors V07P8010A (Sensor 5), on the upper interior surface of the wing, and V07P8058A (Sensor 6), on the lower interior surface of the wing. Sensor 5 failed abruptly at EI+497. Sensor 6, which was slightly more protected, began falling at EI+495, and failed completely at EI+505. Closeout pho- tographs show that the wiring from Sensor 5 travels down from the top of the wing to join the uppermost harness, A, which then travels along the leading edge spar. Similarly, wiring from Sensor6 travels up from the bottom of the wing, joins harnessA, and continues along the spar. It appears that Sensor 5' s wiring, on the upper wing surface, was damaged at EI+497, right after Sensor 1 failed. Noting the times of the sensor failures, and the locations of Sensors 5 and 6 forward of Sensors 1 through 4, spar burn-through must have oc- curred near where these wires came together.
また、8番RCCパネルのすぐ後ろに 2つの圧力センサーが設置されていました。主翼の上面裏側の V07P8010A(センサー5)と下面裏側のV07P8058A (センサー6)です。センサ−5はEI+497の時点で機能を喪失しました。センサー6はもう少し長く生き残り、EI+495から異常が始まりEI+505には完全に機能を喪失しました。ハッチ閉鎖前の写真によると、センサ−5のケーブルは主翼上部から下に向い、前縁部桁にそって走っているハーネスAと合流しています。同じように、センサ−6のケーブルは主翼下面から上に向かい、ハーネスAと合流しています。主翼上部を走るセンサー5のケーブルは、センサ−1が機能を喪失した直後のEI+497に破壊されました。センサ−5と6の設置場所は、センサ−1から4より機首寄りです。主翼桁が焼き切られたのはこれらのケーブルが合流している箇所のそばだったに違いありません。
Two of the 45 left wing strain gauges also recorded an anom- aly around EI+500 to EI+580, but their readings were not erratic or off-scale until late in the re-entry, at EI+930. Strain gauge V12G9048A was far forward on a cross spar in the front of the wheel well on the lower spar cap, and strain gauge V12G9049A was on the upper spar cap. Their responses appear to be the actual strain at that location until their failure at EI+935. The exposed wiring for most of the left wing sensors runs along the front of the spar that crosses in front of the left wheel well. The very late failure times of these two sensors indicate that the damage did not spread into the wing cavity forward of the wheel well until at least EI+935, which implies that the breach was aft of the cross spar. Because the cross spar attaches to the transition spar behind RCC panel 6, the breach must have been aft (outboard) of panel 6. The superheated air likely burned through the outboard wall of the wheel well, rather than snaking forward and then back through the vent at the front of the wheel well. Had the gases flowed through the access opening in the cross spar and then through the vent into the wheel well, it is unlikely that the lower strain gauge wiring would have survived. Finally, the rapid rise in Sensor 4 at EI+425, before the other sensors began to fail, indicates that high temperatures were responsible. Comparisons of sensors on the outside of the wing leading edge spar, those inside of the spar, and those in the wing and left wheel well indicate that abnormal heating first began on the outside of the spar behind the RCC panels and worked through the spar. Since the aluminum spar must have burned through before any cable harnesses attached to it failed, the breach through the wing leading edge spar must have occurred at or before EI+487.
また、左翼に45個ある応力ゲージのうち2つが、EI+500からEI+580にかけて異常な値を示していました。しかし、これらの値は再突入後ずっとあとまで安定しており、EI+930の時点まで機能喪失はありませんでした。応力ゲージV12G9048Aは、主着陸脚収納部の前方に位置するクロス桁の前、下部桁型材(lower spar cap)に設置されていました。また、応力ゲージV12G9049Aは上部桁型材(upper spar cap)に設置されていました。これらのセンサーは機能を喪失するEI+935の時点まで、その位置で通常記録される応力の値を示していました。左翼のセンサーのケーブルの大半は、この主着陸脚収納部の前方に位置する桁の前を走っています。これら2つのセンサーの機能喪失がかなり遅いことから、少なくともEI+935までは主着陸脚収納部前方の空間まで破壊は進んでいなかったことが分かります。これは、主翼の破壊がこのクロス桁より後ろ(外側)で起きたことを示しています。クロス桁は6番RCCパネル背後の中間桁(transition spar)に接続されていることから、破壊は6番パネルより後ろ(外側)で起きたことが分かります。おそらく高熱の大気は、着陸脚収納部の前方の壁の蛇行した通気口をくぐり抜けたのではなく、外側の壁を焼き切ったと思われます。下部の応力ゲージのケーブルが生き残っていることを考慮すると、高熱の大気がクロス桁の整備用の穴を抜け、通気口を抜けて収納部内に入り込んだとは考えられません。また、EI+425の時点、つまり他のセンサーが機能を喪失する前に起きたセンサー4の急激な数値の上昇は(エラーなどではなく、実際の)温度上昇が原因と考えられます。主翼前縁部桁より前(外側)のセンサーや桁の内側のセンサー、主翼内部のセンサー、左着陸脚収納部のセンサーを比較した結果から、異常な温度上昇は主翼桁の外側、RCCパネルの背後から始まり、その後に主翼桁を突き抜けたものと考えられます。高温の空気がアルミの桁を突き抜けたのは、そこに設置されたケーブルのハーネスが焼き切れる前だったはずです(ケーブル類は桁の内側に設置されていました)、つまり、主翼前縁部桁の破損は、EI+487の時点ないしそれより前に起きたということになります。
Other abnormalities also occurred during re-entry. Early in re-entry, the heating normally seen on the left Orbital Maneuvering System pod was much lower than usual for this point in the flight (see Figure 3.6-9). Wind tunnel testing demonstrated that airflow into a breach in an RCC panel would then escape through the wing leading edge vents behind the upper part of the panel and interrupt the weak aerodynamic flow field on top of the wing. During re-entry, air normally flows into these vents to equalize air pressure across the RCC panels. The interruption in the flow field behind the wing caused a displacement of the vortices that normally hit the leading edge of the left pod, and resulted in a slowing of pod heating. Heating of the side fuselage slowed, which wind tunnel testing also predicted.
大気圏突入中にはこれ以外にも異常が起きていました。再突入の初期段階で、軌道制御システム収納部(Orbital Maneuvering System pod)の温度が全体的に通常その地点で記録されるはずの値よりも低い数値を示していました(図:3-6-9)。風洞テストにより、RCCパネルの破損箇所に侵入した空気の流れがパネルの上部後方の通気口から吹き出し、主翼の上の空気の流れをわずかに阻害することが分かりました。本来ならば、これらのパネル上部の通気口は、RCCパネル内の気圧を均一にするために空気が外から中へ向かって流れ込みます。逆に通気口から空気が吹き出し、主翼の後ろの空気の流れが阻害されたことで、軌道制御システム収納部にぶつかる渦がずれ、温度の上昇が普段より遅れたと考えられます。また、胴体側面の温度上昇も普段より遅れたであろうことが、風洞実験の結果から分かりました。
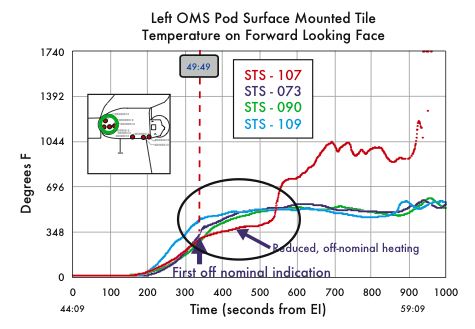
Figure 3.6-9. Orbital Maneuvering System (OMS) pod heating was initially significantly lower than that seen on previous Colum- bia missions. As wing leading edge damage later increased, the OMS pod heating increased dramatically. Debris recovered from this area of the OMS pod showed substantial pre-breakup heat damage and imbedded drops of once-molten metal from the wing leading edge in the OMS pod thermal tiles.
図3-6-9: 軌道制御システム (OMS) ポッドの温度はそれまでのコロンビアのミッションの数値より低い値を示しています。後半、主翼前縁部の破壊が進むにしたがって、OMSポッドの温度は急激に上昇します。回収されたOMSポットの該当部分の破片には、空中分解の前に激しい熱のダメージを受けた跡が残っていました。また、主食前縁部から流れ出た溶けた金属の雫がOMSポッドの耐熱タイルに埋まっているのが発見されました。
To match this scenario, investigators had to postulate damage to the tiles on the upper carrier panel 9, in order to allow sufficient mass flow through the vent to cause the observed decrease in sidewall heating. No upper carrier panels were found from panels 9, 10, and 11, which supports this hypothesis. Although this can account for the abnormal temperatures on the body of the Orbiter and at the Orbital Maneuvering System pod, flight data and wind tunnel tests confirmed that this venting was not strong enough to alter the aerodynamic force on the Orbiter, and the aerodynamic analysis of mission data showed no change in Orbiter flight control parameters during this time.
このシナリオを採用する上で、胴体側面の温度上昇を妨げるのに十分な量の空気が通気口から吹き出したと考えるためには、上部9番キャリアパネルに損傷があったと仮定する必要がありました。9番、10番、11番の上部キャリアパネルが発見されていないことはこの仮説を支持するものです。しかし、この仮説はオービターの胴体と軌道制御システムの温度の異常を説明しますが、飛行データと風洞テストの結果から、この通気口だけでは後にオービターが受けた空力学的な影響を与えるには不十分であることが分かっています。また、ミッションデータの空力学的な分析が行われましたが、この時点でオービターのフライトコントロールの数値には全く変化がありませんでした。
During re-entry, a change was noted in the rate of the temperature rise around the RCC chin panel clevis temperature sensor and two water supply nozzles on the left side of the fuselage, just aft of the main bulkhead that divides the crew cabin from the payload bay. Because these sensors were well forward of the damage in the left wing leading edge, it is still unclear how their indications fit into the failure scenario.
また、再突入の間に機首のRCCパネルクレビスの温度センサーの数値および胴体左側の2つの給水ノズルの温度の上昇率に変化が現れていました。これらのセンサーは左翼前縁部の損傷部分よりも前方に設置されており、事故に至るシナリオとの関連性は未だによく分かっていません。
Sensor Loss and the Onset of Unusual Aerodynamic Effects (EI+500 through EI+611)
センサーの機能喪失と空力的な異常の始まり (EI+500 から EI+611)
Fourteen seconds after the loss of the first sensor wire on the wing leading edge spar at EI+487, a sensor wire in a bundle of some 150 wires that ran along the upper outside corner of the left wheel well showed a burn-through. In the next 50 seconds, more than 70 percent of the sensor wires in three cables in this area also burned through (see Figure 3.6-10). Investigators plotted the wiring run for every left-wing sen- sor, looking for a relationship between their location and time of failure.
EI+287に最初のセンサーのケーブルが焼き切れてから14秒後、150本のケーブルを束ねた中の一本、左主着陸脚収納部の上部外側の角を走るセンサーのケーブルが焼き切れました。次の50秒間で、このエリアの3つのケーブルの束のうち、70%以上のセンサーのケーブルが焼き切れました(図3-6-10)。調査員達は、左翼に設置された全てのセンサーのケーブルをプロットし、機能喪失のタイミングと設置場所との関係を検討しました。
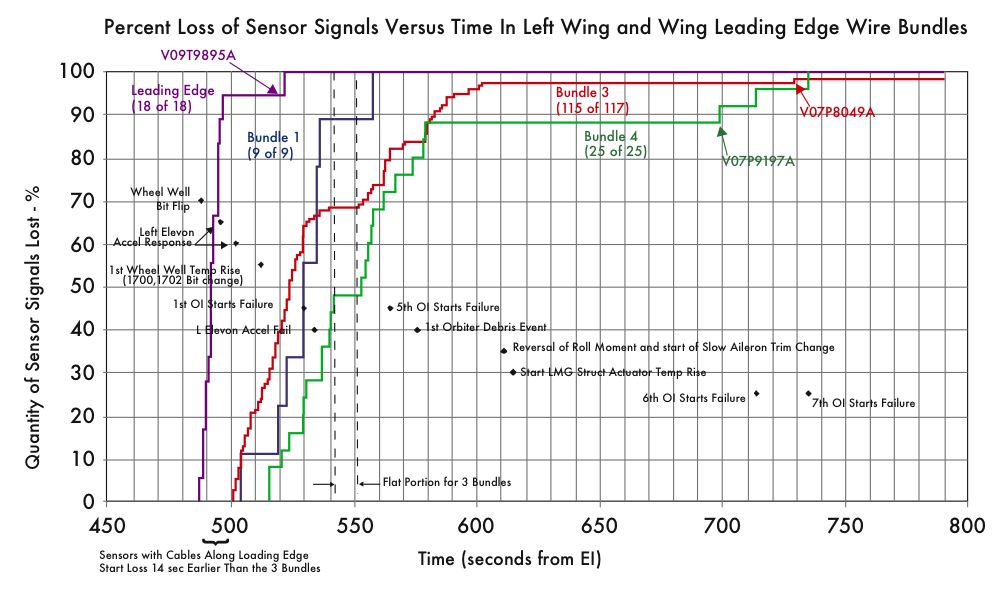
Figure 3.6-10. This chart shows how rapidly the wire bundles in the left wing were destroyed. Over 70 percent of the sensor wires in the wiring bundles burned through in under a minute. The black diamonds show the times of significant timeline sensor events.
図3-6-10 (クリックで拡大) : このチャートは、左翼のワイヤーの束が急速に破壊されたことを示しています。センサーケーブルの束の内の70%を越えるケーブルが一分以内に焼き切れています。また菱形のマークは主要なセンサーの異常が起きたタイミングを表しています。
Only two sensor wires of 169 remained intact when the Modular Auxiliary Data System recorder stopped, indicating that the burn-throughs had to occur in an area that nearly every wire ran through. To sustain this type of damage, the wires had to be close enough to the breach for the gas plume to hit them. Arc jet testing (in a wind tunnel with an electri- cal arc that provides up to a 2,800-degree Fahrenheit air- flow) on a simulated wing leading edge spar and simulated wire bundles showed how the leading edge spar would burn through in a few seconds. It also showed that wire bundles would burn through in a timeframe consistent with those seen in the ModularAuxiliary Data System information and the telemetered data.
補助データシステムモジュールが機能を喪失したとき、169本あるケーブルのうち無傷だったのはたった2本でした。これは、ケーブルの焼き切れた箇所が,全てのワイヤーが一ヵ所に集まっている場所の近くで起きたことを示しています。このようなダメージが起きるためには、これらのワイヤーが高熱のガスを受けるくらい主翼の破損箇所に近くなければなりません。アークジェットテスト(風洞内で電気的な放電を発生させ華氏2800度の空気の流れを作り出します)を、主翼前縁部桁とそこに設置されたワイヤーの束を模したものに対して行ったところ、主翼桁は数秒で焼き切れてしまいました。また、ワイヤーの束が焼き切れるタイミングは補助データシステムモジュールのデータおよびテレメトリデータの結果と一致しました。
Later computational fluid dynamics analysis of the mid- wing area behind the spar showed that superheated air flowing into a breached RCC panel 8 and then interacting with the internal structure behind the RCC cavity (RCC ribs and spar insulation) would have continued through the wing leading edge spar as a jet, and would have easily allowed superheated air to traverse the 56.5 inches from the spar to the outside of the wheel well and destroy the cables (Figure 3.6-11). Controllers on the ground saw these first anomalies in the telemetry data at EI+613, when four hydraulic sensor cables that ran from the aft part of the left wing through the wiring bundles outside the wheel well failed.
後に行われた、主翼中央、主翼桁の後方部分の空力学的なシミュレーションでは、高温になった空気が破損した8番RCCパネルから主翼内に進入し、RCCパネル内部の構造物(RCCパネルのリブと主翼桁の断熱材)と相互作用しながら、ジェット流となって主翼前縁部桁を突き抜け、主翼桁と主着陸脚収納部の外壁との56.5インチの隙間を横切って、ケーブルを破壊したことが分かりました(図3-6-11)。地上の管制官は、これらの最初の異常の兆候をEI+613の時点でテレメトリーデータによって確認しています。それは、左翼の後方から主着陸脚収納部の外側を走る4つの油圧センサーのケーブルが機能を喪失したことによるものでした。
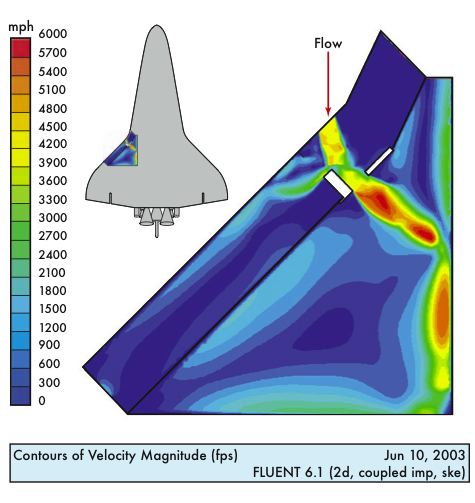
Figure 3.6-11. The computational fluid dynamics analysis of the speed of the superheated air as it entered the breach in RCC panel 8 and then traveled through the wing leading edge spar. The dark- est red color indicates speeds of over 4,000 miles per hour. Tem- peratures in this area likely exceeded 5,000 degrees Fahrenheit. The area of detail is looking down at the top of the left wing.
図3-6-11: これは、8番RCCパネルの破損箇所から侵入し主翼前縁部桁を越えた高温の空気の流れの速さに関する流体力学的なシミュレーションです。暗い赤色の箇所は流速が時速4000マイルを越えていたことを示しています。これらの箇所は温度が華氏5000度を越えていたと思われます。詳細図は左翼を上から見下ろした図になっています。
Aerodynamic roll and yaw forces began to differ from those on previous flights at about EI+500 (see Figure 3.6-12). Investigators used flight data to reconstruct the aerodynamic forces acting on the Orbiter.This reconstructed data was then compared to forces seen on other similar flights of Columbia and to the forces predicted for STS-107. In the early phase of fight, these abnormal aerodynamic forces indicated that Columbias flight control system was reacting to a change in the external shape of the wing, which was caused by progressive RCC damage that caused a continuing decrease in lift and a continuing increase in drag on the left wing.
EI+500の時点で、これまでの飛行では見られなかったロール方向(機体を傾ける方向)とヨー方向(機首を左右に振る方向)の空力学的な力がかかりはじめました(図3-6-12)。調査員は飛行データを利用して、オービターにかかった空力的な力を推測しました。これらの結果は、コロンビアの他の飛行で見られた数値やSTS-107での予測値と比較されました。飛行の初期段階で記録されたこれらの異常は、コロンビアのフライトコントロールシステムが主翼の変形に対抗したことを示しています。この変形は徐々にRCCパネルが破損したことによって起き、左翼の徐々に揚力を低下させ、空気抵抗を増していきました。
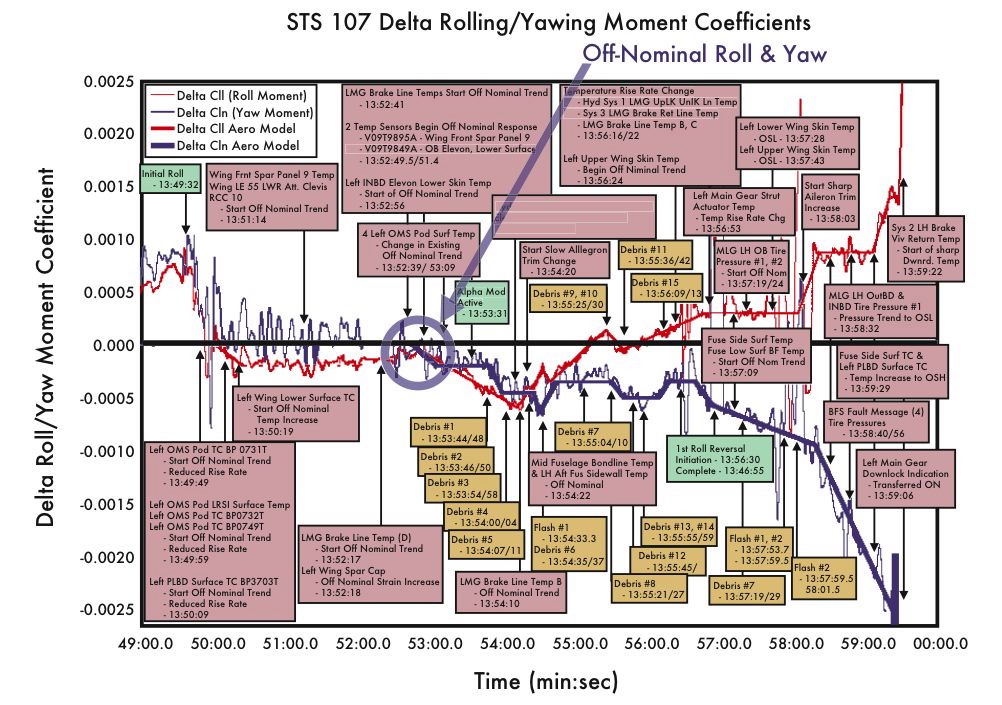
Figure 3.6-12. At approximately EI+500 seconds, the aerodynamic roll and yaw forces began to diverge from those observed on previous flights. The blue line shows the Orbiters tendency to yaw while the red line shows its tendency to roll. Nominal values would parallel the solid black line. Above the black line, the direction of the force is to the right, while below the black line, the force is to the left.
図3-6-12(クリックで拡大) :EI+500前後で、ロール方向とヨー方向の空力的な力がかかり、これまでの飛行とは異なる数値を示し始めます。図は、青い線がヨー方向の、赤い線がロール方向のオービターの動きを表しています。また、黒い線は、通常の飛行の値を表し、黒い線から上が右側方向への力、下側が左側方向の力をそれぞれ表しています。
Between EI+530 and EI+562, four sensors on the left in- board elevon failed. These sensor readings were part of the data telemetered to the ground. Noting the system failures, the Maintenance, Mechanical, and Crew Systems officer notified the Flight Director of the failures. (See sidebar in Chapter 2 for a complete version of the Mission Control Center conversation about this data.)
EI+530からEI+562にかけて、左翼の内側のエレボンに設置された4つのセンサーが機能を喪失しました。これらのセンサーの値は、テレメトリに含まれて地上へ送信されました。メンテナンス・メカニカル・乗務員関連システム主任(MMACS)は、これらの機能喪失はシステムの不具合ではないとフライトディレクターに報告します。(第2章 2-6-1のMission Control Center Communication のこのデータに関する会話を参照して下さい)
At EI+555, Columbia crossed the California coast. People on the ground now saw the damage developing on the Or- biter in the form of debris being shed, and documented this with video cameras. In the next 15 seconds, temperatures on the fuselage sidewall and the left Orbital Maneuvering System pod began to rise. Hypersonic wind tunnel tests indi- cated that the increased heating on the Orbital Maneuvering System pod and the roll and yaw changes were caused by substantial leading edge damage around RCC panel 9. Data on Orbiter temperature distribution as well as aerodynamic forces for various damage scenarios were obtained from wind tunnel testing.
EI+555に、コロンビアはカルフォルニアの海岸を通過しました。この時、地上にいた人々が損傷の進んだオービターから破片状のものが落下するのを目撃します。また、この様子はビデオにも記録されました。続く15秒間で胴体側面と軌道制御システムの温度が上昇しはじめます。超音速風洞でのテストによると、軌道制御システムの温度上昇とロールとヨーの変化は9番RCCパネル付近が大きく破壊されていたことによるものと思われます。これらの損傷の進行のシナリオでのオービターの温度分布や空力学的な力は、風洞実験によって得られたものです。
Figure 3.6-13 shows the comparison of surface temperature distribution with an undamaged Orbiter and one with an en- tire panel 9 removed. With panel 9 removed, a strong vortex flow structure is positioned to increase the temperature on the leading edge of the Orbital Maneuvering System pod. The aim is not to demonstrate that all of panel 9 was miss- ing at this point, but rather to indicate that major damage to panels near panel 9 can shift the strong vortex flow pattern and change the Orbiters temperature distribution to match the Modular Auxiliary Data System information. Wind tun- nel tests also demonstrated that increasing damage to lead- ing edge RCC panels would result in increasing drag and decreasing lift on the left wing.
図3-6-13は、損傷の全くない状態のオービターと9番RCCパネルを完全に取り去ったものについて表面の温度分布を比較したものです。9番パネルを取り去ったものでは、強い渦が発生して軌道制御システムの前部の温度を上昇させています。これは、この時点で9番パネルが全て失われたことを意味するのではなく、9番パネル付近の損傷が強い渦を生み出し、オービターの温度分布の予測値が補助データモジュールシステムに記録された値と一致することを示すものです。風洞テストではさらに、主翼前縁部のRCCパネルの損傷が空気抵抗を増し、揚力を低下させることが分かりました。
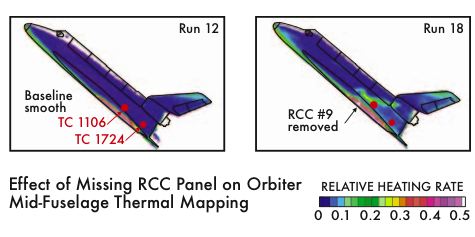
Figure 3.6-13. The effects of removing RCC panel 9 are shown in this figure. Note the brighter colors on the front of the OMS pod show increased heating, a phenomenon supported by both the OMS pod temperature sensors and the debris analysis.
図3-6-13: 9番RCCパネルを取り去ったことによるオービターの表面温度への影響を示します。OMSポッドの前部が明るい色で示され高温になっているのに注意してください。これは、OMSポッドのセンサーの値と回収された破片の分析結果を支持するものです。
Recovered debris showed that Inconel 718, which is only found in wing leading edge spanner beams and attachment fittings, was deposited on the left Orbital Maneuvering System pod, verifying that airflow through the breach and out of the upper slot carried molten wing leading edge material back to the pod. Temperatures far exceeded those seen on previous re-entries and further confirmed that the wing lead- ing-edge damage was increasing.
回収された破片から、主翼前縁部のスパナー梁と結合金具にしか使用されていないインコネル718が、左軌道制御システムのポッドに溶着しているのが発見されました。これは、損傷部分から入り込んだ空気の流れが上部のスリットから吹き出て、溶けた主翼前縁部の素材をボッドへと運んだことを示します。温度はこれまでの再突入の時よりもずっと高い数値を示し、主翼前縁部の損傷はさらに大きくなっていきました。
By this time, superheated air had been entering the wing since EI+487, and significant internal damage had probably occurred. The major internal support structure in the mid- wing consists of aluminum trusses with a melting point of 1,200 degrees Fahrenheit. Because the ingested air may have been as hot as 8,000 degrees near the breach, it is likely that the internal support structure that maintains the shape of the wing was severely compromised.
EI+487の時点で高熱の空気は主翼内部に入り込み、主翼内部に深刻なダメージを与えていたと思われます。主翼中央部分の主要な構造物は融点が華氏1200度のアルミのトラスでできていました。侵入した空気は破損箇所付近で華氏8000度に達しており、主翼の形を支えている内部構造はかなり傷つけられていました。
As the Orbiter flew east, people on the ground continued to record the major shedding of debris. Investigators later scrutinized these videos to compare Columbias re-entry with recordings of other re-entries and to identify the debris. The video analysis was also used to determine additional search areas on the ground and to estimate the size of various pieces of debris as they fell from the Orbiter.
オービターが西に向かうにしたがって、地上にいる人々は機体からさらに大きな破片が脱落するのを目撃しています。調査員は、これらのビデオ映像を仔細に検討しコロンビアこれまでの飛行と比較して脱落した破片を特定しました。また、これらのビデオ映像は捜索範囲を拡張する際や破片のサイズの特定に使用されました。
Temperatures in the wheel well began to rise rapidly at EI+601, which indicated that the superheated air coming through the wing leading edge spar had breached the wheel well wall. At the same time, observers on the ground noted additional significant shedding of debris. Analysis of one of these "debris events" showed that the photographed object could have weighed nearly 190 pounds, which would have significantly altered Columbias physical condition.
着陸脚収納部の温度は、EI+601からはっきりと上がりはじめました。これは高熱の空気が主翼前縁部桁を突抜け、着陸脚収納部の壁面に達したことを示しています。同時刻に地上から観測していた人々がさらに大きな破片の脱落を目撃しています。これらの破片の落下に関する分析から、撮影された写真に写っている破片は190ポンド近くあったことが分かっています。このような破片の脱落はコロンビアの状態を大きく変化させたはずです。
At EI+602, the tendency of the Orbiter to roll to the left in response to a loss of lift on the left wing transitioned to a right-rolling tendency, now in response to increased lift on the left wing. Observers on the ground noted additional sig- nificant shedding of debris in the next 30 seconds. Left yaw continued to increase, consistent with increasing drag on the left wing. Further damage to the RCC panels explains the increased drag on the left wing, but it does not explain the sudden increase in lift, which can be explained only by some other type of wing damage.
EI+602の時点で、オービターの左翼の揚力が失われたことによる左側へのロール傾向は右側へのロールへと変化します。これは左翼の揚力が増えたことによるものです。地上から観測していた人々は、続く30秒間でさらに大きな破片の脱落を目撃しています。左翼の空気抵抗が増えたことによって、左向きのヨーは更に増加を続けていました。空気抵抗の増加はRCCパネルがさらに破壊されたことによって説明できますが、揚力の増加を説明するためには別の原因が必要です。
Investigators ran multiple analyses and wind tunnel tests to understand this significant aerodynamic event. Analysis showed that by EI+850, the temperatures inside the wing were high enough to substantially damage the wing skins, wing leading edge spar, and the wheel well wall, and melt the wings support struts. Once structural support was lost, the wing likely deformed, effectively changing shape and re- sulting in increased lift and a corresponding increase in drag on the left wing. The increased drag on the left wing further increased the Orbiters tendency to yaw left.
複数の分析を実行し風洞テストを行うことで、このときの空力的な状態が明らかになりました。この分析によると、EI+850の時点で、主翼内部の温度は、主翼の表面、主翼前縁部桁、着陸脚収納部壁などへダメージを与え、主翼を支える支柱を溶かすほどになっていました。構造的な支えが無くなると主翼は非常に変形しやすくなります。実際に変形が起こり、左翼の揚力が増加し、空気抵抗が増しました。この空気抵抗の増加は、さらにオービターのヨー傾向を強めることになりました。
Loss of Vehicle Control (EI+612 through EI+970)
コントロール不能に (EI+612 から EI+970)
A rise in hydraulic line temperatures inside the left wheel well indicated that superheated air had penetrated the wheel well wall by EI+727. This temperature rise, telemetered to Mission Control, was noted by the Maintenance, Mechani- cal, and Crew Systems officer. The Orbiter initiated and completed its roll reversal by EI+766 and was positioned left-wing-down for this portion of re-entry. The Guidance and Flight Control Systems performed normally, although the aero-control surfaces (aileron trim) continued to counter- act the additional drag and lift from the left wing.
主着陸脚収納部内部の油圧ラインの温度の上昇は、高熱の大気が収納部の壁を突き抜けたこととを示しています。この温度上昇はミッションコントロールで受信され、メンテナンス・メカニカル・乗務員関連システム主任によって確認されています。EI+766の時点で、オービターはロールリバーサルを終了していましたが、この時点でもオービターは左翼を下げた姿勢を取っていました。
操縦翼(エルロントリム)は左翼の空気抵抗と揚力を打ち消す動きを続けていましたが、誘導およびフライトコントロールシステムは問題なく動作していました。
At EI+790, two left main gear outboard tire pressure sen- sors began trending slightly upward, followed very shortly by going off-scale low, which indicated extreme heating of both the left inboard and outboard tires. The tires, with their large mass, would require substantial heating to produce the sensors slight temperature rise. Another sharp change in the rolling tendency of the Orbiter occurred at EI+834, along with additional shedding of debris. In an attempt to maintain attitude control, the Orbiter responded with a sharp change in aileron trim, which indicated there was another significant change to the left wing configuration, likely due to wing de- formation. By EI+887, all left main gear inboard and out- board tire pressure and wheel temperature measurements were lost, indicating burning wires and a rapid progression of damage in the wheel well.
EI+790には、左主着陸脚の外側の2本のタイヤの空気圧を計測するセンサーの数値がわずかに上昇しはじめ、直後に計測不能な値まで下がりました。これは、内側と外側の両方のタイヤが非常に高い熱に曝されたことを意味しています。これらのタイヤは非常に大きく、センサーの値が多少でも上昇するためにはかなり大きな熱が必要です。また、再び大きな破片の脱落が観測されたEI+834には、オービターのロール傾向にも急激な変化がありました。高度を維持するためにオービターがエルロントリムを急激に変化させたのです。これは、左翼に更に大きな変化、例えば大きな変形などがあったことを示します。EI+887までに、外側、内側、全ての左主着陸脚の圧力の値が失われ、温度を計測するセンサーの値も失われました。これは着陸脚収納部の損傷が急速に進み、ケーブルが焼き切れたことを示しています。
At EI+897, the left main landing gear downlock position indicator reported that the gear was now down and locked. At the same time, a sensor indicated the landing gear door was still closed, while another sensor indicated that the main landing gear was still locked in the up position. Wire burn-through testing showed that a burn-induced short in the downlock sensor wiring could produce these same contradictions in gear status indication. Several measurements on the strut produced valid data until the final loss of telemetry data. This suggests that the gear-down-and locked indica- tion was the result of a wire burn-through, not a result of the landing gear actually deploying. All four corresponding proximity switch sensors for the right main landing gear re- mained normal throughout re-entry until telemetry was lost.
EI+897には、左主着陸脚の位置とロックの状態を示すインジケーターが、着陸脚が降りた状態でロックされていると表示してきました。しかし同時に、あるセンサーは主着陸脚収納部のドアが閉じていることを示しており、他のセンサーは着陸脚が上がった状態でロックされていることを示していました。ケーブルの燃焼テストから、ケーブルが燃えたことによってショートが起こり、着陸脚に関する矛盾したセンサーの報告が引き起こされることが分かりました。支柱に取り付けられた数個のセンサーは最後のテレメトリデータの喪失まで信頼できるデータを送っています。つまり、着陸脚が降りた状態でロックされているという表示はケーブルが焼き切れたことによるものであり、実際に着陸脚が降りていたわけではありません。対応する右主着陸脚の4つのスイッチのセンサーは再突入時からテレメトリが失われるまでの間ずっと通常の値を示していました。
Post-accident analysis of flight data that was generated af- ter telemetry information was lost showed another abrupt change in the Orbiters aerodynamics caused by a contin- ued progression of left wing damage at EI+917. The data showed a significant increase in positive roll and negative yaw, again indicating another increase in drag on and lift from the damaged left wing. Columbias flight control sys- tem attempted to compensate for this increased left yaw by firing all four right yaw jets. Even with all thrusters firing, combined with a maximum rate of change of aileron trim, the flight control system was unable to control the left yaw, and control of the Orbiter was lost at EI+970 seconds. Mission Control lost all telemetry data from the Orbiter at EI+923 (8:59:32 a.m.). Civilian and military video cameras on the ground documented the final breakup. The Modular Auxil- iary Data System stopped recording at EI+970 seconds.
テレメトリデータが失われたあとの飛行データを事故後に分析した結果から、EI+917の時点で更に急激な空力的な変化が起きていたことが分かりました。データには急激なプラス方向(右方向)のロールとマイナス方向のヨーが記録されていました。これは、再び損傷した左翼の空気抵抗と揚力が増加したことを示しています。コロンビアのフライトコントロールシステムは、この左ヨーの増加を打ち消すために4つある全ての右ヨージェット(ヨー角を制御するためのスラスター)を噴射しています。しかし、全てのヨージェットを噴射し、エルロントリムを最大まで変化させたにもかかわらず、フライトコントロールシステムはこの左ヨーの増加を抑制することができませんでした。そして、EI+970にコロンビアはコントロール不能に陥りました。EI+923(AM 8:59:32)にミッションコントロールはオービターからの全てのテレメトリーデータを受け取れなくなりました。一般市民と軍によって撮影されたビデオは最終的な空中分解を記録しています。そして、補助データモジュールシステムの記録はEI+970秒で終わっていました。
Findings:
所見:
F3.6-1
The de-orbit burn and re-entry flight path were normal until just before Loss of Signal.
The de-orbit burn and re-entry flight path were normal until just before Loss of Signal.
F3.6-1
軌道離脱噴射と、再突入時の飛行ルートはシグナルの喪失時まで通常通りだった
軌道離脱噴射と、再突入時の飛行ルートはシグナルの喪失時まで通常通りだった
F3.6-2
Columbia re-entered the atmosphere with a pre- existing breach in the left wing.
Columbia re-entered the atmosphere with a pre- existing breach in the left wing.
F3.6-2
コロンビアは左翼に損傷を抱えたまま大気圏に突入した。
コロンビアは左翼に損傷を抱えたまま大気圏に突入した。
F3.6-3
Data from the Modular Auxiliary Data System recorder indicates the location of the breach was in the RCC panels on the left wing leading edge.
Data from the Modular Auxiliary Data System recorder indicates the location of the breach was in the RCC panels on the left wing leading edge.
F3.6-3
補助データモジュールシステムレコ−ダーから得られたデータは、損傷箇所が左翼のRCCパネルにあったことを示している。
補助データモジュールシステムレコ−ダーから得られたデータは、損傷箇所が左翼のRCCパネルにあったことを示している。
F3.6-4
Abnormal heating events preceded abnormal aerodynamic events by several minutes.
Abnormal heating events preceded abnormal aerodynamic events by several minutes.
F3.6-4
空力的な異常の前に、数分間に渡って異常な高温による現象が起きている。
空力的な異常の前に、数分間に渡って異常な高温による現象が起きている。
F3.6-5
By the time data indicating problems was teleme- tered to Mission Control Center, the Orbiter had already suffered damage from which it could not recover.
By the time data indicating problems was teleme- tered to Mission Control Center, the Orbiter had already suffered damage from which it could not recover.
F3.6-5
異常を示すデータがミッションコントロールセンターに送信されてきた時点で、すでにオービターは回復不能な損傷を受けていた。
異常を示すデータがミッションコントロールセンターに送信されてきた時点で、すでにオービターは回復不能な損傷を受けていた。
Recommendations:
勧告:
R3.6-1
The Modular Auxiliary Data System instrumen- tation and sensor suite on each Orbiter should be maintained and updated to include current sensor and data acquisition technologies.
The Modular Auxiliary Data System instrumen- tation and sensor suite on each Orbiter should be maintained and updated to include current sensor and data acquisition technologies.
R3.6-1
各オービターに搭載された補助データモジュールシステムとセンサー類を保守・整備し、最新のセンサーとデータ収集技術を用いたものに交換すること
各オービターに搭載された補助データモジュールシステムとセンサー類を保守・整備し、最新のセンサーとデータ収集技術を用いたものに交換すること
R3.6-2
The Modular Auxiliary Data System should be redesigned to include engineering performance and vehicle health information, and have the ability to be reconfigured during flight in order to allow certain data to be recorded, telemetered, or both, as needs change.
The Modular Auxiliary Data System should be redesigned to include engineering performance and vehicle health information, and have the ability to be reconfigured during flight in order to allow certain data to be recorded, telemetered, or both, as needs change.
R3.6-2
補助データモジュールシステムを、工学的な性能と機体に異常がないかどうかをチェックできるものに設計しなおすこと。また、これらのシステムが記録したり送信したりするデータのうち、どのデータを記録・送信するかを必要に応じて飛行中に変更できるようにすること。
補助データモジュールシステムを、工学的な性能と機体に異常がないかどうかをチェックできるものに設計しなおすこと。また、これらのシステムが記録したり送信したりするデータのうち、どのデータを記録・送信するかを必要に応じて飛行中に変更できるようにすること。
THE KIRTLAND IMAGE